
Over the last few years, two major developments in the way poverty is conceptualised and measured stand out. These regard, respectively, poverty’s multi-dimensionality and its dynamic nature over time. Developing measurement techniques which appropriately capture these important aspects of poverty has been a very active area of research lately. The vast majority of contributions though have focused on capturing either the multi-dimensional aspect, or the temporal aspect, and have not attempted to deal with both simultaneously.
In a recent CSAE working paper co-authored with Jing You and Sangui Wang, we apply the intertemporal poverty indicator recently developed by Dutta et al. (2013) to two important dimensions – income and nutrition – and propose a generalised recursive selection model to investigate the determinants of households’ multi-dimensional and intertemporal wellbeing in two less developed provinces in northwest China, namely Gansu and Inner Mongolia.
China has experienced an economic miracle of a sustained 8-10% annual growth rate in GDP per capita, and this has enabled it to reduce its poverty rate from 84.3% in 1981 to 6.3% in 2011 (based on the US $1.25-a-day (PPP) line). In sum, 753 million people in China have escaped poverty in this period, and this comprises three quarters of the total number of people in the entire East Asia & Pacific region who were lifted out of poverty during this time. Nevertheless, in 2011, 85 million people in China remained poor. Two-thirds of these people live in western areas (Poverty Monitoring Report, 2011).
Our dataset was collected by the National Bureau of Statistics (NBS) local branches, and covers 1,500 households in 150 villages from 15 counties. Of these, 700 households from 7 counties are in Gansu and the remaining 800 households are from 8 counties in Inner Mongolia. Gansu is one of the poorest provinces in China; its real per capita GDP has consistently ranked in the bottom 3 out of 31 provinces for two decades (1990-2010). By contrast, Inner Mongolia was ranked in the middle of these provinces (16th-20th) throughout this period. The latter is characterised by rich natural resources, typically coal mines, animal husbandry and related processing industries such as meat, dairy and cashmere.
The trend in aggregate income poverty incidence in these two provinces, denoted by the red lines in Figure 1, is found to be broadly decreasing over the period, notwithstanding a 4 percentage point increase between 2000 and 2001 due to a severe drought in Inner Mongolia. Strikingly, however, the reduction in income poverty was not accompanied by an improvement in nutrition – a vital dimension of human well-being. Figure 1 indicates a clear trend of increasing under-nutrition under a threshold of 2,100 kcal per person per day. The nutritional poverty rate (gap) increased by 12% (14.4%) from 2000 to 2004, while household equivalent per capita net income grew by 31% concurrently. On average, 70% of households in the sample lived on less than 2,100 kcal per person per day.
Figure 1 Poverty rates in Gansu and Inner Mongolia
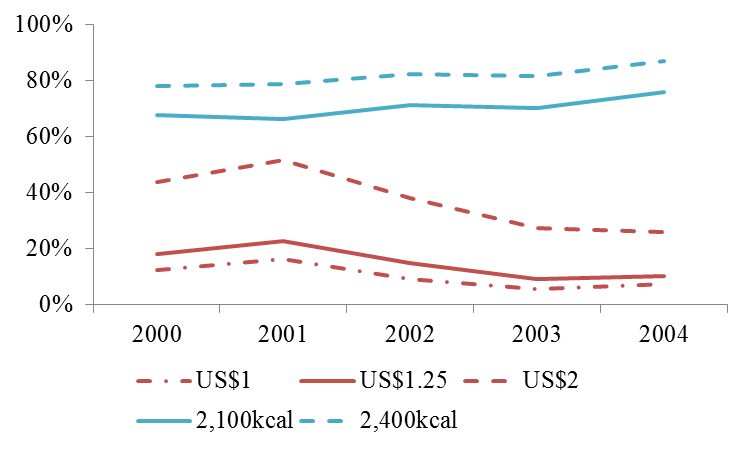
Note: The three (red) lines at the bottom are income poverty rates. The two (blue) lines at the top are nutritional poverty rates.
In this study we estimate Dutta et al.’s (2013) intertemporal poverty measure for income and nutrition, respectively. An individual’s poverty status over the entire five-year period is aggregated in a way that accounts for:
(1) Previous hardship. Specifically, poverty in a given period is treated as being exacerbated if it was also preceded by a poor spell. This reflects the fact that prolonged spells in poverty can be particularly detrimental, for a wide variety of reasons including physical, psychological and social factors.
(2) Previous affluence. Non-poor spells can mitigate the deprivation experienced in subsequent poor spells through a variety of non-income channels such as assets, health, social networks, human capital and so on.
In the nutritional dimension, we find that a major problem is a persistent shortage of nutrition, at a household level, in remote rural areas: 81% of those without sufficient nutrition in a given period continue to suffer in this way in the subsequent period. Overall, our intertemporal nutritional analysis paints a much more pessimistic picture than the widely reported (and, nonetheless, clearly extremely welcome) statistics on the greatly reduced numbers of people in income poverty.
The aids and subsidies in rural China, as in many other developing countries, are targeted to the poor, as defined by the national income poverty line. Those “not-so-poor” who live barely above this line are excluded from these projects, yet such people are still vulnerable to poverty and various risks and shocks, and this seems to be reflected in their poor nutritional status in our sample.
To the extent that intertemporal poverty is the focus of policy makers, our analysis suggests that household-focused interventions generally outperform village-level instruments. In the early stages of development, and when agriculture is a dominant element of individuals’ livelihood, improvement in agricultural production, both in terms of increased agricultural labour productivity and of larger farm size and investment in productive assets, still holds the key to reducing both intertemporal income and nutritional poverty. This is true whether focusing on the poorest of the poor, or when the richer poor are also included, by adopting higher poverty lines. The finding is also robust to different normative assumptions underlying intertemporal poverty aggregation over time. Furthermore, when there is evidence suggestive of intertemporal poverty-nutrition traps, higher labour productivity in agriculture in the long-term holds more potential for breaking the vicious circle, in both income and nutritional dimensions, than does local non-agricultural production or out-migration.
Our results suggest that the purported positive roles of local non-agricultural production and out-migration in reducing monetary poverty might be overblown, at least as an intertemporal phenomenon. They are certainly not magic bullets. Rather, whatever effect they have on both income and nutritional dimensions is likely to be highly context specific and dependent on other factors.
Dissemination of agricultural technologies and better living conditions also help reduce intertemporal poverty to some extent, but only in the short-term. Moreover, their impact is highly sensitive to which particular dimension of deprivation policymakers aim to tackle, and which specific technology or mechanisation households adopt. Such instruments need to be implemented with caution and an awareness of contextual specifics, as our analysis suggests that they can have unintended negative consequences, both for household income and nutrition.
Table 1 Intertemporal Poverty Profiles
| Group | Income | Nutrition |
| Full sample | 0.063 | 0.521 |
| Geography | ||
| Gansu | 0.067 | 0.318 |
| Inner Mongolia | 0.058 | 0.698 |
| Ethnicity | ||
| Han | 0.121 | 0.759 |
| Minorities | 0.058 | 0.500 |
| Labour allocation | ||
| Agriculture | 0.069 | 0.513 |
| Local non-agriculture | 0.040 | 0.544 |
| Circular migration | 0.090 | 0.510 |

How can a scientific study be “multi-dimensional” and miss time as one dimension still? Sounds a bit weird to me …