The Global Cost of Violence

CNN interviewed Anke Hoeffler on the global cost of violence. The news feature was based on a new report by James Fearon and Anke Hoeffler that estimates the annual costs of violence at around $9.5 trillion, which is about 11 per cent of World GDP.  In their study they consider the costs resulting from civil wars, homicides, assaults and violence against women and children (figure 1).

Slide1Figure 1 – The global cost of violence

While civil wars receive a lot of attention, they are relatively rare events. People are more at risk from other forms of violence. Approximate prevalence rates are:

  • 1 in 100,000 people die in civil conflicts
  • 9 in 100,000 people are victims of homicides
  • 16,000 in 100,000 children are subjected to severe physical punishment
  • 12,000 in 100,000 women are assaulted by their intimate partner

The high prevalence rates of violence against women and children make it the most costly type of violence; about 85 per cent of our total cost estimate is due to violence against women and children.

The authors argue that the post-2015 MDGs should include targets on violence reduction. While a world free of violence may be an unrealistic target, the world is now more peaceful than at the end of the Cold War and some countries (such as the US and the UK) have seen a reduction in some forms of violence (homicide rates, intimate partner violence) over the past 20 years.  Ambitious targets and programs for public health problems, such as the eradication of small pox, Rinderpest, Guinea worm, polio and measles have been very successful over the past six decades. As advances in medical science have resulted in a decline in deaths from communicable diseases, social causes of death, such as violence, have become relatively more important.

The report also highlights that almost no development aid is spent on the prevention of violent crime (only about 0.27 per cent of total aid spending). The little aid that is spent on the improvement of judicial systems and police performance is mainly spent in post-conflict countries.

Setting violence reduction targets would acknowledge that the global agenda is evolving and would promote research in finding ways to reduce violence in low and middle income countries. The authors argue for moving beyond a near-exclusive focus on civil war violence – concern with which has increased in the development community and is admirable and important – to recognizing that the costs of interpersonal violence are probably much larger but are almost wholly neglected in current development programming.

The report is part of the Copenhagen Consensus Project

http://www.copenhagenconsensus.com/

The link to the interview is:

http://www.cnn.com/video/data/2.0/video/business/2014/09/15/wbt-domestic-violence-costs.cnn.html

Share
Posted in Uncategorized | Tagged , , , , , , | Comments Off on The Global Cost of Violence

From rebellion to electoral violence

Promoting democratisation and elections has been at the core of peace-building missions in post-conflict societies since the end of the Cold War. Recent examples are Afghanistan, the Democratic Republic of Congo, Iraq and Libya, just to name a few. Democratisation has been considered as a key factor for supporting the governments’ accountability and legitimacy, which ultimately fosters social trust and make violence relapse less likely. Nonetheless, elections failed to be implemented properly in a vast majority of post-conflict countries in Africa. A recent study by Bishop and Hoeffler (2014) reveals that during the 1975-2011 period, 80% of African polls were spoiled by violence, bribery, intimidation or inequitable government interference (Figure 1).

figure1Figure 1 – Electoral Malpractices in Africa from 1975 to 2011

Understanding the causes of electoral misconducts is all the more important to prevent its adverse economic consequences, the destruction of social capital, a weakening of the State’s capacity and its devastating effects on the living conditions of civilians.

In a new working paper, Olivia D’Aoust, Olivier Sterck and Andrea Colombo discuss the origins of the electoral violence that spoiled the 2010 elections in Burundi. Burundi is a small landlocked country located in the Great Lakes region in sub-Saharan Africa and it is ranked 178th out of 187 countries according to the Human Development Index. Its GDP per capita was USD 267 in 2013 (The World Bank).

The history of Burundi has been characterised by deeply anchored cleavages between its two major ethnic groups, the Hutu and the Tutsi. Ethnic rivalries constituted the ground for tensions and ethnic massacres that culminated in the 1993 civil war between the Tutsi-led army and Hutu rebel groups. After the Arusha peace agreement was signed in 2000, two rebels groups remained active on the ground: the CNDD-FDD and the Palipehutu-FNL. In 2004, the CNDD-FDD laid down its weapons. One year later, its leader, Pierre Nkurunziza, won the elections. Burundi then became the battleground for the two rival Hutu rebel groups. During four years, the new Hutu government fought against the Palipehutu-FNL, which finally demobilised in 2009, putting an official end to the civil war. The first post-civil war elections were organised a few months later in May 2010.

The pre-electoral climate was spoiled by numerous violent episodes, claims of intimidation and suspicions of fraud. The aim of our study is to understand whether the ex-combatants played a role in triggering electoral violence. We also assess whether electoral violence had any socio-economic, ethnic or political grounds.

We show that episodes of electoral violence in 2010 were channelled through enmities between Hutu rebels, eventually bursting during the electoral competition. The local distribution of Hutu demobilised soldiers, based on their affiliation during the civil war, was indeed a prominent determinant of violence: the more a municipality was polarised (through the presence of two opposing groups of ex-combatants), the more likely electoral violence occurred. Figure 2 displays the number of events predicted by the distribution of ex-soldiers as a function of the number of groups of similar size in each municipality. It predicts a five-fold increase in electoral violence between the lowest- and highest-polarised municipalities.

figure2

Figure 2. Predicted number of events as a function of projected number of groups of the same size

 We also show that municipalities that had been heavily exposed during the 1993-2009 civil war were more prone to violence in 2010. On the contrary, the Hutu-Tutsi rivalry was not a good predictor of electoral malpractices. As a matter of fact, the demobilised soldiers’ polarisation effect was stronger in municipalities where the Hutu were the majority. Political competition did not matter either when tensions between ex-rebel groups were accounted for. The key for tackling electoral malpractices in Burundi may then reside in the role played by demobilised soldiers within the political arena during the campaigning process.

Policy-wise, our research urges for a democratisation process to be tailor-made on the basis of a country’s specific political and historical contexts. Elections, even if combined with demobilisation programmes, are not sufficient for establishing sustainable peace in post-conflict societies like Burundi. Policies facilitating the transition from rebellion to political competition, within a sounder institutional framework, should be enhanced.

Burundi’s 2015 elections are fast approaching and the incumbent president does not seem to be willing to conform to the constitutional requirement of ceding the term of office (BBC news). Burundi’s internal stability will thus be challenged, once again.


Share
Posted in Institutions and Growth | Tagged , , , , , , | 1 Comment

How useful is education in Africa?

Travelling around any poor country in sub-Saharan Africa (SSA) the visitor is struck by how far schools outnumber factories. The large number of schools is due partly to the success of one of the MDGs which is that primary education should be available to all children. According to World Bank data the primary completion rate for boys in SSA increased from 58 to 73 percent between 1999 and 2012 and for girls from 48 to 66 per cent. But why all these schools and no factories? Isn’t the idea that education should enable the newly educated young to have better jobs and aren’t those better jobs likely to be in factories?

That this schooling is useful is virtually unquestioned in discussions of development policy. True there will be concern at the quality of the education, at the fact that much of this education is not free and that girls do not have equal access to the education. But surely its usefulness is self-evident?

In this blog I want to argue that its value in enabling the newly educated to earn more is far from self-evident. The inference, rather obviously, is not that the young should not be educated. The inference is that we need to understand what does make education useful for increasing earnings. (I am not arguing that this is the only, or indeed the most important, function of primary education, it is just the one I wish to focus on). While, rather out of character, all economists would agree that education and earnings are highly correlated beyond that they revert to normal and agree on very little. The question we need an answer to, and it turns out to be a very hard question to answer, is how does education at different levels affect earning opportunities?

Figure 1 below shows why we care a lot about the earnings gain at different levels of education in SSA. The extent of the investment in primary education has dramatically changed the skill composition of Africa’s population. In 1960 some 90 per cent of Africa’s adult population had no education meaning that they had failed to complete primary level. By 2010 this proportion had roughly halved and similar proportions, 40 per cent, had no education as had primary. The implication is rather stark – the vast majority of the increase in education that has been achieved has been at the primary level. Unless education at this level increases earnings then the very large increases in education that have been achieved will not have increased earnings.

 Figure 1: Percentages of Skilled and Unskilled Labour sub-Saharan Africa

figure1

So how does primary education affect earnings? There is no agreement as to the answer to that question. There is a long history in this area of arguing that primary education is the most valuable aspect of education in the sense that the earnings increase at that level is highest. That is the argument advanced by George Psacharopoulos and his collaborators. Where this view has been confronted with actual earnings, usually wages, the result has been rather different. Figure 2 shows the pattern across four sub-Saharan African countries where it appears low levels of education have negligible returns. The figure does not show that education at the primary level did not raise earnings. It may be the case that it did but something else, we do not know what, reduced it so the net effect was zero. While such charts do not tell us about causes they do tell us about outcomes and for the primary educated the outcomes appears a rather unhappy one.

In a recent working paper drawing on the DPhil work of Rulof Burger (WPS/2014-10) a different approach is taken to this question. This uses industrial sectoral data for South Africa to link education, not to earnings, but to labour productivity. The findings here are radically different from the shape showing how earnings and education are linked. In this study low levels of education have by far the highest returns. This result is of interest partly because it is, as far as I know, the first to find such an effect and partly because the data enables a range of tests which suggest the result is fairly robust. Why then the difference between this result and the convex function shown in Figure 2?

Figure 2: Earnings in Manufacturing Firms in Africa

figure2

We do not know but I would like to suggest one possibility. This is that the data is from South Africa which differs from the rest of SSA in that most employment is wage employment in firms. It is true that there are not nearly enough such jobs in South Africa but that is a different issue. The employment structure is very different from the rest of SSA. Is it the case that education to be useful in increasing earnings needs to be linked to the kind of jobs and if those jobs are there then education is indeed far more valuable? Such an interpretation is speculative. When earnings are regressed on education the shape of the function for South Africa is very similar to that shown in Figure 2. Why such different patterns emerge as to how education impacts on earnings from how it impacts on productivity is a puzzle.

If the high return to primary education found in South Africa’s sectoral data is due to its industrial structure then the picture with which we began of many schools and very few factories is indeed a problem. Without the factories the dramatic increase in the primary educated work force will indeed see little economic gain from their education. The recent increases in the demand for education beyond the primary level certainly suggests that both students, and their parents, are aware that low levels of education have little value in the job market place. Focusing on meeting that demand rather than focusing on why that demand has arisen may well be to miss the critical problem facing educational policy in Africa.


Notes:

Figure 1 is based on the data provided by:  Barro, R.J., Lee, J-W. (2010) “A new data set of educational attainment in the world, 1950-2010”, Journal of Development Economics, Volume 104, September 2013, Pages 184–198.

The sources for the data used in Figure 2 can be found at:http://www.csae.ox.ac.uk/datasets/main.htm. A statement of Geoge Psacharopoulos’ arguments can be found at: Psacharopoulos, G. and Patrinos, H. A. (2004) Returns to investment in education: a further update”, Education Economics, Vol. 12, No. 2, August.

Share
Posted in Jobs, Finance and Skills | Tagged , , , , , | 1 Comment

Agricultural Technology and Structural Change

Developing countries employ a relatively large share of their workers in agriculture, and the labor productivity of those agricultural workers is only a fraction of that found in the developed world. Together, these two facts account for a significant portion of the gap in aggregate output per worker between the developing and developed world. Low productivity in the agricultural sector keeps most workers employed there despite low productivity because of the “food problem”, as T.W. Schultz termed it. To provide enough food to meet subsistence, most workers have to remain in the agricultural sector. This implies that increasing agricultural productivity would free up workers to shift into non-agricultural sectors like manufacturing and services, increasing output per worker and expanding the variety of goods that people can consume.

While agricultural productivity improvements can drive development, we argue in our paper that agricultural technology determines how effective those improvements are. By technology we mean the elasticity of agricultural output with respect to labor. This makes technology different from productivity. Productivity determines how big the marginal product of a worker is (high in rich countries, low in poor countries), but technology determines how fast that marginal product changes in response to a change in the labor supply.

We do two things in our recent CSAE working paper (co-authored by Markus Eberhardt and Dietrich Vollrath). First, we use recent advances in panel time-series econometrics to estimate agricultural production functions on a country-by-country basis. We are able to let both productivity and technology vary across countries. Once we have technology estimates for each country, we look at how that those estimates vary by climate group. We find that countries that are predominantly in cold and/or temperate climate zones have very low elasticities of agricultural output with respect to labor, about 0.15, meaning that the marginal product of labor doesn’t change much as we move labor into or out of agriculture. In contrast, countries in equatorial zones or highland zones tend to have high elasticities, 0.35–0.55, meaning that the marginal product of labor is very sensitive to the amount of labor in agriculture.

The second thing we do in the paper is calibrate a simple model of structural change and development to see how important those differences in technology are for things like the labor share in agriculture or output per worker. What we find is that the low labor elasticities in temperate zones allow economies to respond very rapidly to improvements in agricultural productivity. Given a productivity shock, temperate economies are able to move a lot of workers out of agriculture, because the marginal product of those that stay remains relatively large. Thus the structural transformation occurs very quickly in these economies, and this shows up as more non-agricultural output and higher output per worker. In response to the same shock to productivity, equatorial and highland economies move fewer workers out of agriculture, because the marginal product of remaining workers falls very quickly, and thus their structural transformation is slower and does not provide as big of a boost to output per worker. They certainly benefit from productivity increases, but not to the same degree as in temperate economies.

One easy way to see the implications of agricultural technology is to look at the following figure. This shows, in our model, how much agricultural total factor productivity (TFP) would have to rise in order to push the agricultural labor share down to 3\%, similar to levels seen in rich countries today. The poorest temperate zone countries, like Malawi (MWI), would need TFP to rise by a factor of 10. But an equatorial country like Tanzania (TZA) or a highland one like Ethiopia (ETH) would need TFP to rise by a factor of 20 or 40, respectively. It is easier for temperate economies to transform their economies from agriculture to industry, because their agricultural technology has a low elasticity of output with respect to labor.

If we look across countries, then one reason that some countries are relatively poor may be their agricultural technology has not allowed them to take advantage of productivity increases as rapidly as temperate zone countries. We use our model to calculate several counter-factual situations, and find that roughly 20\% of the variance in cross-country output per worker could be attributable to differences in agricultural technology. Another way of saying this is that the ratio of the 90th percentile to the 10th percentile country in terms of output per worker is roughly 22/1 now. This ratio would be only about 15/1 if all countries had an agricultural technology with a labor elasticity of only 0.15.

figureFigure 1 – Relative Agricultural TFP Increase

While our research indicates that equatorial and highland zone countries are at a disadvantage in making a structural transformation, we should be clear that our results do not indicate some kind of “geographic determinism”. That is, there is nothing in our research that says those countries are doomed to be poor. You can see in the figure 1 that there are relatively rich highland and equatorial countries. But at any given level of output per worker, equatorial and highland countries will require larger productivity increases to reach higher levels of development than their temperate zone peers.

Share
Posted in Uncategorized | Tagged , , , , , , | Comments Off on Agricultural Technology and Structural Change

How to increase your GDP without anyone noticing

African GDP statistics have been in the news recently. Both Ghana and Nigeria in West Africa have seen revisions to their GDP which, in the case of Ghana, has made it a middle income country with per capita GDP, in purchasing power parity US$ dollars, of over 3,000 US$ and in the case of Nigeria has made it the largest economy in Africa.

These statistical innovations clearly do not change the incomes of individuals in those economies but they do suggest that rather dramatic gains have been made recently within Africa. While GDP data is clearly problematic in very poor countries the picture the GDP figures suggest of major improvements in the level of activity in those countries is borne out by a range of data sources. If these figures are correct they suggest a puzzle. Why if progress is being made is there such concern for the lack of employment opportunities, particularly for the young, and why are Nigerians not celebrating more?

My recent working paper for the CSAE looks at these issues, not from the point of view of macro data, but from the perspective of employment creation in Nigeria and the incomes those jobs create. The paper documents three rather remarkable “facts” about job creation in Nigeria over the period from 1999 to 2006. The first is that the number of jobs has increased in line with population. The second is that the number of wage jobs has actually declined in absolute terms. The third is that most job creation has been within the rural sector. In summary, small scale self-employment activities have become increasingly important over a time a relatively rapid GDP growth. As with most data on Africa these “facts” are open to dispute but I argue in the working paper that the evidence from household surveys strongly points towards their broad accuracy.

If correct, this pattern of job creation can help explain the disconnect between the GDP numbers and the working experience of most Nigerians particularly the young. They are told, probably correctly, that their nation’s income is increasing rapidly but they see no access to those increased incomes for themselves. The lack of connect is due to the lack of higher income jobs. The fact that jobs have increased in line with population does not mean that there are plenty of jobs Nigerians want. Some 25 per cent of those aged from 15 to 64, who are not in full time education, are defined as out of the labour force. That means that applying standard definitions they are not seeking work and are therefore presumed not to want employment. It is extremely likely these would take jobs if there were more better paid ones. The problem is not jobs it is the incomes from those jobs and the data we have for 2004 suggest median private sector urban earnings of about US$80 per month. Is it little wonder, seeing the plutocratic lifestyles of those with access to the oil rents, that faced with such job opportunities Nigerians are angry and bitter?

Figure 1

figure

It is important to be clear the problem is incomes from jobs not the provision of more wage jobs. While private wage jobs do, on average, produce more income than those in self-employment a critical issue is the extent of the distribution of incomes within occupational categories and the overlaps across these sectors. For the urban sector the extent of the overlap between private wage and self-employment activities is shown in figure 1. It is the very low incomes we observe in Nigeria at the bottom of the distribution, for both wage and the self-employed, that accentuate the disconnect between increasing prosperity for Nigeria as a country and the lot of most of its population. For the young this disconnect can appear grotesque. In 2006, for those aged 15 to 25, less than 5 per cent had access to any wage job (that excludes those in full time education) and only 15 per cent had an urban self-employment income. Nearly 50 per cent were classified as either out of the labour force or unemployed. Failing so dramatically to supply income sources for so many, and the young in particular, does seem an excellent way of increasing your GDP and ensuring most do not notice.

Share
Posted in Uncategorized | Tagged , , , , , , | Comments Off on How to increase your GDP without anyone noticing

The Potential for Mobile Technology to Improve Agricultural Efficiency

The spread of mobile technology has been transformative in many developing countries. Mobile phones have lowered price dispersion, enabled mobile banking and transfers, and connected an increasing number of people to the internet.

Agricultural production in developing countries has been relatively less transformed by mobile phones and the spread of cheap processing power. This may be changing however.  One study lead by Shawn Cole and Asanga Nilesh Fernando in India for example looks at mobile phones as a potential means of spreading information about agricultural issues, which in the future could potentially be a less costly and more efficient approach than traditional extension activities.

Village_au_centre_de_l'Ethiopie_(2)Figure 1 – Village in central Ethiopia, along the national road 1, between Addis Abeba and Debre Birham (Author: Ji-Elle). http://commons.wikimedia.org/wiki/File:Village_au_centre_de_l%27Ethiopie_%282%29.jpg

In a new working paper, Davide La Torre and I discuss a different way in which mobile technology may affect small hold farmers in the future. We focus on an ever-present problem for small hold farmers: how to efficiently manage risk? In many instances, farmers diversify the crops that they hold so that shocks to one type of crop will not lead to overwhelming losses. Other methods include insurance or government support programs that help out when farmers have a particularly unlucky season.

Our contribution borrows from the finance literature, and particularly research into defining optimal investment choices in a portfolio. We use data from the Ethiopia Rural Household Survey and the Ethiopian Central Statistics Agency to demonstrate a set of techniques for estimating optimal investment allocation in smallholder farming. The approaches treat farming tasks, constraints, and investments as a portfolio problem, characterized by multiple competing objectives. We formulate several versions and solve them, estimating all model parameters using real data.

Such an exercise could just as easily be applied using a basic smartphone, highlighting the potential for expanding the applications for use in supporting farmers. As computing costs decline and mobile technologies become more prevalent, it will become increasingly easy to equip extension agents and others with programs that can calculate optimal portfolios that are specifically tailored to the desires of individual farmers.

The idea of the paper is not to argue that a couple of economists can create a model to tell farmers what to do. Instead, we highlight approaches that help farmers systematically evaluate the choices that they individually think are most important. Using real data, we provide examples of how this can be straightforwardly done. Leveraging publically available information about agricultural markets and marrying this information with the specific preferences of individual farmers can potentially lead to risk mitigating strategies that are less costly. Using technology in this way can also more easily evaluate information about price trends and production costs that are not easily considered without an organized approach.

Share
Posted in Uncategorized | Tagged , , , , , , | Comments Off on The Potential for Mobile Technology to Improve Agricultural Efficiency

Conflict Minerals, Consumers and Industry Lobbying

For years a number of academics and advocacy groups have highlighted the role of minerals in civil wars.  Minerals like tin, tantalum, tungsten and gold often provide rebel groups with a valuable source of finance. For example a number of armed groups in the Democratic Republic of the Congo control the mining and trade of Coltan, a local abbreviation for the ore columbite-tantalite, from which tantalum is extracted. It is used in many electronic devices, for example mobile phones. Coltan is exported and processed in Europe and Asia. Consumers should have the right to know that they are buying products free from “conflict minerals” and Global Witness and other advocacy groups have campaigned to restrict the trade of minerals from conflict areas. In the US the Dodd–Frank Wall Street Reform and Consumer Protection Act requires companies to report and make public the use of so-called “conflict minerals”. In Europe, industry lobbing has been much stronger and prevents any binding regulation. In March 2014 the EU Commission proposed a system of self-certification for importers of tin, tantalum, tungsten and gold but stopped short of making it a legal requirement.

7589159588_eee701a1c6_o croppped“Democratic Republic of the Congo (DRC) Colton/Tantalum” by Responsible Sourcing Network, used under CC BY-NC (https://www.flickr.com/photos/sourcingnetwork/7589159588) (cropped image)

The German public broadcaster (ARD) investigated the links between industry and EU politicians. This short film documents how the German lobby group BDI (“The voice of German Industry”) prevented a European anti “conflict minerals” law.  I was one of the experts interviewed in this documentary and I stated that although a number of voluntary agreements already exist, “conflict minerals” are still finding their way into consumer goods. Thus, I suggest that it is now time to adopt legally binding regulation to restrict the access to finance for armed groups.


Link to EU self-certification proposal

http://europa.eu/rapid/press-release_IP-14-218_en.htm

Link to the ARD Report page (like BBC1 Panorama)

http://www.br.de/fernsehen/das-erste/sendungen/report-muenchen/videos-und-manuskripte/buergerkriege-mineralien-wirtschaftslobby100.html

Share
Posted in Uncategorized | Tagged , , , , , | Comments Off on Conflict Minerals, Consumers and Industry Lobbying

State Capacity in Developing Countries

A state that is able to protect its citizens, enforce property rights and provide public goods acts as the backbone of a functional economy. Researchers call this ability of the state to carry out its objectives ‘state capacity’, and there is more and more exciting research being done on its determinants,  on the outcomes associated with high or low capacity, and on how to ‘engineer’ state capacity. This year, the CSAE conference dedicated its closing plenary panel, featuring Timothy Besley, Stefan Dercon and Kieran Holmes and chaired by Paul Collier, to this research.  As Tim Besley pointed out during his introductory remarks, we know that markets take care of themselves, it is a (mal)functioning government we need to be worried about.

One of the most important dimensions of state capacity is the ability to raise taxes. Not just any taxes, but taxes that guarantee as much ‘production efficiency’ as possible (Diamond & Mirrlees, 1971). This capacity is not a given, witnessed by the fact that developed countries raise significantly more income taxes as opposed to trade taxes than developing countries. More broadly, we know that the total tax revenue as a percentage of GDP or the extent to which property rights are protected are highly positively correlated with prosperity (Besley & Persson, 2011 and figure 1 in Acemoglu, 2005, below).

 8614798Figure 1: Tax revenue and GDP. Source: Acemoglu (2005)

Developing countries routinely struggle to raise half of their annual budget, increasing their reliance on foreign aid. So how do we, in practice, extend the capacity of states to raise taxes? First and foremost, all panellists agree that there has to be a willingness to expand the tax base and collection efficiency. In many countries, elites feel their privileged positions threatened by such reforms and, since they hold power, successfully block them (see for instance Acemoglu & Robinson, 2012). Because of these concerns DFID takes an explicit political economy perspective, focusing on helpring countries to self-finance their way out of poverty. Central to self-financing your way out of poverty is, of course, the ability to raise taxes.

It is this ability to raise taxes that the last panellist, Kieran Holmes, has spent most of his career advancing. Kieran currently works with the Burundi government to (re)build its tax capacity. He emphasizes a practical approach, from removing walls in between offices in the tax department to having tax officers report their income. He does, however, emphasize that elite opposition, inexperience and a general fear of accountability are major obstacles.

All panellists pointed to the role of culture, something Besley has recently worked on in the context of the (in)famous Thatcher poll tax. How to accomplish this is not clear, but a culture of tax compliance is, in the end, the most effective way to ensure a sustainable fiscal state. The debate has shown us that state capacity should indeed be at the heart of any development efforts and that significant progress has already been made. However, much more research into measurement of capacity and lack thereof, effective policy tools and the role of culture is needed!

References

Acemoglu, Daron (2005). Politics and economics in weak and strong states. Journal of Monetary Economics, 52 pp. 1199–1226

Acemoglu, Daron and James A. Robinson (2012), Why Nations Fail, New York: Crown Business.

Besley, Timothy and Torsten Persson (2011). Pillars of prosperity: The political economics of development clusters. Princeton: Princeton University Press.

Diamond, Peter A. and James Mirrlees (1971). Optimal taxation and public production I: Production efficiency. The American Economic Review 61(1), 8—27.

Share
Posted in Uncategorized | Tagged , , , , , | Comments Off on State Capacity in Developing Countries

What Schooling Did: The effect of education on the educated, their families and their communities

In the most optimistic view of the world, education is meant to be transformative, changing the fortunes of individuals and their families, and spreading by example to the peers of the educated. While this view accords with the policy rhetoric around education, and with much anecdotal evidence, rigorous evidence is hard to come by especially in developing countries: the decision to open a school or enrol a child is rarely random and so, even if we did observe individuals over a long period of time, it is hard to be convinced that the differences in fortunes did really arise from education and not something else.

Leonard Wantchekon and coauthors’ paper on education in colonial Benin changes that. It asks a big question – what was the causal effect of the introduction of schools in colonial Benin in the early 1900s on the first children enrolled, their descendants, their neighbours and their extended families?

Slide3Figure 1: religious class in Zagnanado

Perhaps the most impressive part of the empirical exercise is the innovativeness and richness of the data collection. The authors identify a set of schools which were the first `Western’ schools in the area and identify reasonable other comparison villages in the same area (arguing persuasively based on historical records that the school placement was exogenous). Within the villages, they identify the first two cohorts of children in these schools and all their cohort members in the `treated’ villages.   This second part is hard (there were no census records or European-style parish registers to be looking back to) and so they create a record of the cohort members by interviewing current village residents about their grandparents and extended families. They argue, based on historical record that elites did not want their children to go to Western schools when they were first introduced, that student selection was either happenstance or random. Having asked a big question, the authors created a dataset going back a hundred years to answer it.


Slide1Slide2

                                              Figure 2: treatment and control groups

The effects are staggeringly large. Those children who were educated in the first cohorts had much better income outcomes and living standards and were overwhelmingly likely to work outside agriculture. As importantly, they were much more likely to be politically active – to join and campaign for political parties or to stand for elections. In this cohort at least, education does lead to empowerment. These effects persist – children of these initially treated individuals continue to get more education and have higher living standards.

If the paper had ended there, these results could have been a source for at least some disappointment: a random shock (being enrolled in a school that just opened) to one generation permanently privileges individuals and their descendants. The rhetoric around education is often about diffusion, the externalities that accrue to peers and to communities. And it is in those areas, that Wantchekon and co-authors provide some of their most interesting findings: a generation later, the gaps between the children of the initially-educated and the initially-uneducated individuals in the villages where a school was opened seemed to have dramatically reduced with the descendants of the uneducated “catching up, and catching up fast, especially in terms of income and social networks.” They document also diffusion through the extended family network with the nieces and nephews of the initially-educated benefiting as much as the children. Taken together, results in this paper seem to suggest quite strongly that being educated early on had large effects on the future outcomes of these individuals and their children, and eventually on their extended families and neighbours; education also brought a greater voice and political participation. This accords with even the most optimistic claims about the effects of education.

Wantchekon and coauthors do a great job of documenting the causal effects on the specific individuals and families who benefited from being early recipients of education. The implications for the returns to education under different circumstances ­— say a different country or a different time, perhaps one where the levels of education were not quite so low — are not clear. These initially treated individuals benefited perhaps by being `early-birds’, valued greatly because their skills were so rare and provided a great mark of distinction, and maybe such results are an upper-bound of what returns to education might be in most contexts today. And that is without engaging with the issues about the quality of education imparted in schools. Still, for this one cohort at a historically opportune moment, education did indeed prove transformative – that is an immensely valuable result in its own right.

Leonard Wantchekon delivered the Keynote Address at the CSAE 2014 Conference titled Education and Human Capital Externalities: Evidence from Colonial Benin.

Share
Posted in Uncategorized | Tagged , , , | 1 Comment

Mobile technologies in Africa

Sub-Saharan Africa has the lowest levels of infrastructure quality in the world. However, 80% of adults in Kenya, Ghana, Nigeria, and Senegal have a mobile phone, despite the fact that a large proportion of them live in poverty with no access to electricity. As shown in figure 1.a and 1.b, mobile phone subscriptions in sub-Saharan Africa have increased dramatically over the past decade, jumping from 15 million in 2000 to 650 million in 2012.

Picture1Picture1b

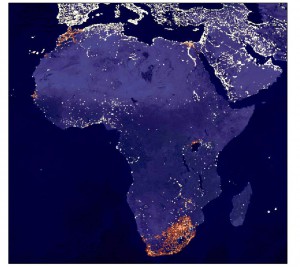
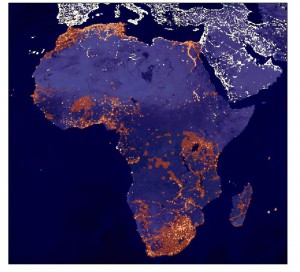
Figure 1: GSM Coverage in 1999 and 2008 (GSM Association, taken from Isaac Mbiti’s slides).

Discussing the opportunities brought about by the spread of this new technology was precisely the objective of the panellists for the first keynote address at the 2014 CSAE conference. For this very interesting session, William Jack (Georgetown University) Ignacio Mas-Ribo (University of Oxford Tufts University) and Isaac Mbiti (Southern Methodist University) were chaired by Simon Quinn (who, ironically, seemed more at ease with computers than the three IT specialists).

The speakers identified four main mechanisms through which mobile phones can provide benefits to their users in Sub-Saharan Africa (see below for a list of references).

First, mobile phones create new business and job opportunities through improved communication and increased access to information. In remote rural areas, farmers are now able to instantaneously learn crop prices in a distant city market without having to pay otherwise unaffordable transport costs. This may in turn increase their bargaining power against intermediaries and stabilize their revenue (provided that the intermediary is not monopolist). Similarly, thanks to mobile phones, day labourers are now able to call peers who live in cities to find out about job opportunities.

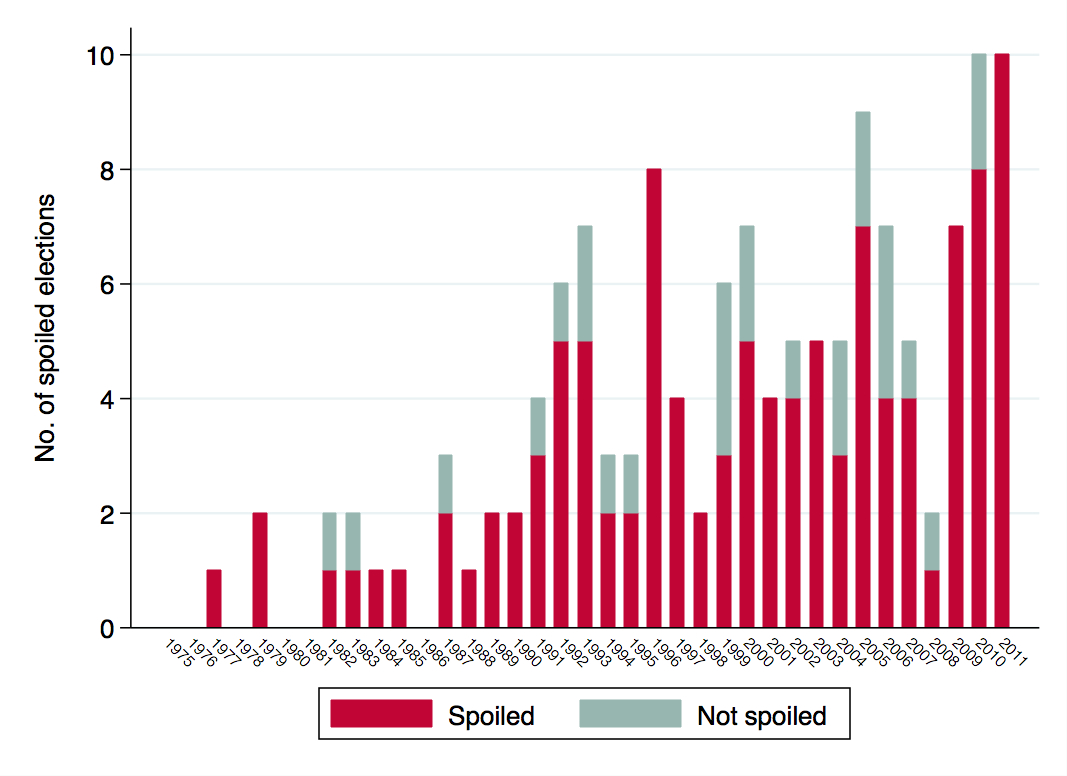
Second, mobile phones provide a very practical platform for improving governance and democracy. In India for example, mobile phones have been successfully used to facilitate the reporting of cases of corruption. In Burundi, Kenya, Mozambique and Nigeria, citizen-based monitoring schemes were put in place in order to report cases of electoral fraud and violence. In a similar way, mobile phones have been used to facilitate election monitoring and increase electoral turnout.

Third, the mobile phone technology improves the quality and the outreach of development programmes related to health, education and emergency response. In high-prevalence countries, people living with HIV can now receive text messages daily, reminding them to take their antiretroviral medication. Mobile phones have also been used all around Africa for monitoring and tracking epidemics outbreaks, for supporting diagnosis and treatment by health workers and for sending health education messages.

Finally, and this was the most important part of this keynote address, mobile phones can improve informal insurance mechanisms and facilitate access to modern banking services via the development of mobile money accounts. Mobile money accounts usually involve a set of applications facilitating financial transactions via mobile phone, including paying bills and transferring money and airtime between individuals. As underlined by Isaac Mbiti, there are now more registered mobile money accounts than bank accounts in Cameroon, DRC, Gabon, Kenya, Madagascar, Tanzania, Uganda, Zambia and Zimbabwe, thereby demonstrating the attractiveness of this service.

Picture2

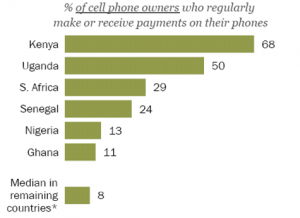
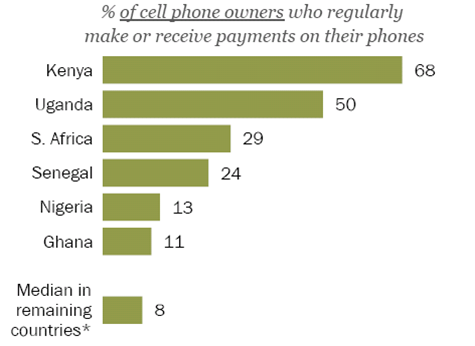
Figure 2: % of cell phone owners who regularly make or receive payments on their phones

The mobile money programme that has received the most attention in the literature (and during this session) is the programme M-Pesa which was launched in 2007 in Kenya. As of September 2009, M-Pesa had 8 million subscribers, with almost 40 percent of Kenyans having ever used the service to send or receive money.

As shown by William Jack, the M-PESA programme allows its users to smooth consumption across income shocks, suggesting that M-PESA reinforces considerably informal insurance mechanisms. In line with this, William Jack showed that remittance networks are larger thanks to M-PESA. Thanks to the programme, remittances are more numerous, larger and travelling further. As show by Isaac Mbiti, money accounts not only improved informal insurance mechanisms directly, they also reduced the cost of remittances in general. Since the introduction of M-Pesa in Kenya, fees charged for domestic transfers by Western Union and MoneyGram fell by about 50%; pressure from M-Pesa accounts for about 60% of this drop.

Of course, the expansion of mobile money did not occur without any difficulties, and the highly-publicized success of M-Pesa is still suffering from replication troubles. As explained by Ignacio Mas-Ribo, since the benefit of joining a network is directly proportional to the number of people already on it, the set-up of mobile money services may be quite complicated. Mobile money therefore needs to reach a critical mass of customers in order to be viable and profitable. Furthermore, current mobile money systems suffer from their limited capacity of storage of value and their limited integration. There remains the question of whether these difficulties should be solved by increased competition or by public action (or both)…

Aker, Jenny C., and Isaac M. Mbiti. 2010. “Mobile Phones and Economic Development in Africa.” Journal of Economic Perspectives, 24(3): 207-32.

Dermish, Ahmed and Kneiding, Christoph and Leishman, Paul and Mas, Ignacio, Branchless and Mobile Banking Solutions for the Poor: A Survey (January 23, 2011). Innovations, Vol. 6, No. 4, Fall 2011.

Jack, William, and Adam Ray, and Tavneet Suri (2013). Transaction networks: Evidence from mobile money in Kenya. American Economic Review: Papers and Proceedings. 103(3): 1–8

Jack, W., & Suri, T. (2014). Risk Sharing and Transactions Costs: Evidence from Kenya’s Mobile Money Revolution. The American Economic Review, 104(1), 183-223.

Mas, Ignacio and Radcliffe, Daniel, Scaling Mobile Money (May 31, 2011). Journal of Payments Strategy & Systems, Vol. 5, No. 3, September 2011.
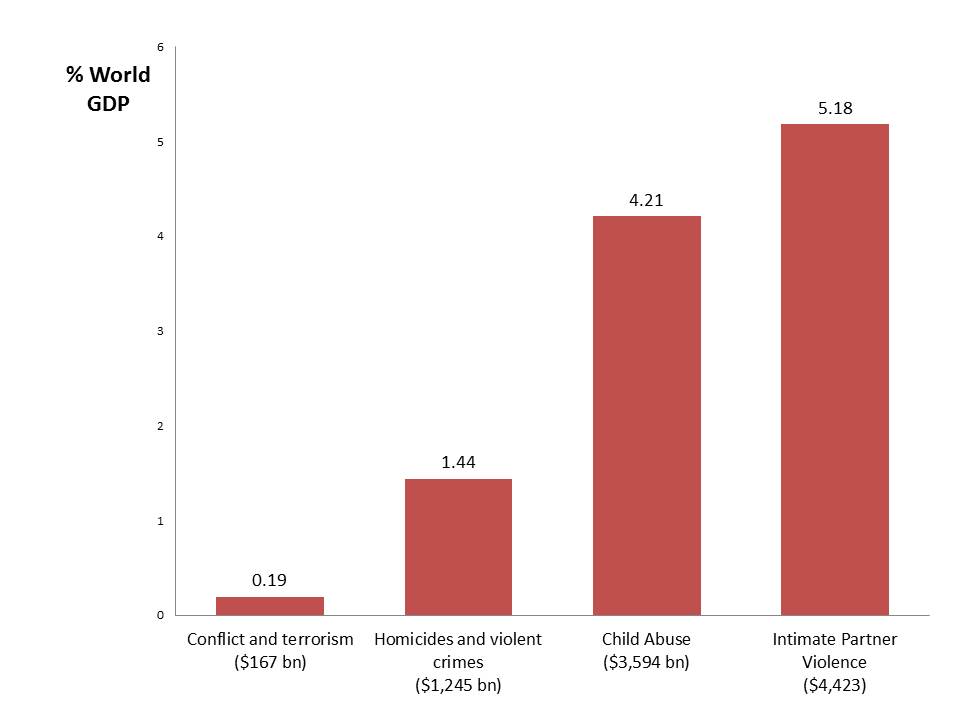
 

Share
Posted in Uncategorized | Tagged , , , , | Comments Off on Mobile technologies in Africa