Africans care about jobs; non-Africans care about institutions?

There’s a lot of chatter in the blogosphere about Westerners’ perceptions of Africa, and how poorly they align with Africans’ own views of the challenges their societies face.

This week I’m in Oxford, for the annual conference on “Economic Development in Africa” at the Centre for the Study of African Economies (CSAE) .  The CSAE conference is unique among top-tier development econ conferences in that it brings together a huge number of scholars based in African universities and research institutes  — as well as people like me, non-Africans working on the economics of Africa.

Looking at the conference program, I thought this might be a good testing ground for this hypothesis about African and Westerners’ divergent priorities.  Do the research topics of African and non-African scholars working on economic development in Africa align?

I decided to take a closer look at the set of 264 papers presented at the conference.  Richard Payne (the CSAE’s IT director, who crafted the conference program and website) kindly shared the spreadsheet underlying the program, with a field indicating the continent-or-origin for the submitting author, and the thematic area they submitted their paper to.  Here’s what the data show:

justin1

It’s a bit hard to draw firm conclusions here, given the large number of topic categories.  But if you squint a little (and group topics into broad conceptual categories), what strikes me is the following: African scholars are disproportionately interested in labour (i.e., jobs), firms (possibly jobs again), and monetary policy.  Non-African scholars are disproportionately interested in political economy, conflict, natural resources, and (an outlier) migration.  Roughly speaking, there’s a division between jobs-focused papers by African researchers and papers by non-Africans focused on institutions.

Also, it’s hard to pass up mentioning that “aid” is a much bigger priority for non-African than African researchers.

Between sessions this morning, I mentioned this pattern to another conference attendee — Bob Rijkers from the World Bank — who asked, sensibly, is this just driven by the CSAE’s own acceptance and rejection decisions?

So I went back to Richard and asked for the full (anonymized) set of paper submissions — over a thousand papers in total.  Sure enough, the pattern looks quite different:

justin2

There are fewer large differences between African and non-African priorities in the full set of submissions.  Labour is still a much higher priority for African researchers, but so are poverty and agriculture.  On the other end, rather than institutions, it seems there are a lot of non-African researchers working on Africa who focus disproportionately on intra-household issues, risk, and social networks.  Interestingly, conflict remains a much more popular topic for non-African than African researchers.

I’m curious what others make of these patterns?  Scanning the categories in the graph, am I right to see systematic patterns, or does this strike people as random noise?  If the patterns are systematic, I’m also curious what the dynamic relationship looks like: comparing across years, are African papers converging to the non-African topics on the Western academic frontier, or are Western researchers listening to their African colleagues who may be closer to the policy dialogue in their respective countries?  Maybe that’s another blog post.

Share
Posted in Institutions and Growth, Jobs, Finance and Skills, News and Updates | Tagged | 9 Comments
Quote

Open Data and Development

“the gentlest hand … modern economy, therefore, is the most effectual bridle ever was invented against the folly of despotism.”  — Sir James Steuart (1767)

Hirschmann, in a classic of modern political economy (Exit, Voice and Loyalty, 1977),  questions the effectiveness of this ‘gentlest hand’, and the traditional notion that despots will be reigned in by economic competition alone. What economists have been slow to embrace, he suggests, is the option of voice: being able to complain—and be heard—when things are broken. Historically, when considering government performance, it has not necessarily been easy to exercise voice, both due to a lack of anyone who will listen, and due to an inability to access and use the information to develop a voice.

Recent noisy uprisings in many countries and regions suggest that voice is a relevant consideration in economic and social change, and that voice is fostered by a range of modern technologies when these are made available. In this post I will look at the Open Data movement, discuss how this increases a people’s voice, and suggest why and how we must embrace this movement.

Open Data is Available

Like open source software, the idea behind Open Data is that this is information which belongs to all people, and which all people should be able to access, analyse, and use as they like. Governments are increasingly making data collected as part of their service delivery available in large online repositories where users can simply search for and download nationally relevant data. Although these initiatives started with governments in developed countries, this is now available in lower-income countries including India, KenyaChile, Uruguay and Morocco, among others. There has also been a push to take this Open Data and use it in ways which benefit social development. Initiatives which build on Open Data such as Code4Kenya and CodeandoXChile are piggybacking on the wave of newly available data to build user-friendly government budget interfaces, open school performance indicators, and provide health access information to citizens. These initiatives came about based on the availability of Open Data but are run and maintained principally by a public who responds to no governmental requirements or restrictions, and who speaks nearly entirely to other members of society.

Open Data has a role in defining how people and governments interact

User-friendly Open Data interfaces—such as those which can be linked with smart phones and publicly accessible computer terminals—can certainly provide citizens with a simplified way to search through complicated databases of public services availabilities and requirements. However, on top of simplifying search for public services, Open Data can act as an important check on State performance. Indicators such as public servant salaries, effectiveness of education providers, ability of law enforcement, and directions on how and where to vote have all been created using large Open Data bases which can be followed in real time by all citizens.

Open Data needs to be used 

The challenge in Open Data then is in generating interfaces to make these large databases accessible. This is a two-part challenge: one part is simply facilitating the visualisation of data and the second part is in opening up access by increasing data-literacy. The first of these challenges, opening large databases and making them understandable in a simple way, is well under way. The World Bank hosts an enormous range of data (8,079 indicators to be exact) which can now be directly (and freely) accessed through programs such as R and Stata.  Front-ends for these programs such as the worldstat Stata module I have made available online are also increasingly common (see figure 1).

mortality

Figure 1: worldstat Africa, stat(MORT) cname


The second part of the challenge, making citizens more data-literate, is perhaps the principal bottleneck in the Open Data movement. While it is certainly a good thing that a larger array of data is available to be communicated with the public, the limits of what is actually done with this freed data are set only by the degree that people are unsure of how to access and what to do with this. Where a larger group of citizens are actively accessing, exploring and communicating the results housed in Open Data repositories, society as a whole will be more engaged with the decisions governments make, and more importantly, how these map into social results. This suggests that digital education may be a worthwhile investment in school curricula – particularly for young girls and boys who truly are digital natives. The availability of massive open online courses, or MOOCs, is a start (such as free access to Harvard’s core computer science class via edX), but for countries to create educated citizens who can contribute to the democratic process (and as an added bonus to a dynamic labour market) teaching coding early would seem to be a worthwhile investment given recent trends in digital development and what we know about first mover advantage.

Open Data needs to be submitted

A burgeoning body of Open Data now exists. We can access information about what our governments spend, where they spend, and what the results of this investment look like. However, there is still much that can be done in this area. There is no need for Open Data to be restricted to national government databases. Economists and others who frequently collect and work with data can also submit their data via open repositories such as Google’s Public Data Explorer. What’s more, the marginal effort in uploading data to these interfaces where it can be used by all is minimal once collection has taken place. We should, wherever practical, begin to consider this as the typical way to communicate data, and barring serious concerns regarding privacy and sensitive information, should encourage national governments to follow the trend of opening up (de-identified) national datasets.

Hirschmann’s words then, as much as any other time, surely still ring true:

“Yet, in this age of protest, it has become quite apparent the dissatisfied … members of an organisation … can ‘kick up a fuss’ and thereby force improved quality or service upon delinquent management.”

We are, as ever, in an age of protest, and the voice society develops will grow louder and harder to refute when it is backed up with relevant data. This data—from independent international organisations and from national governments—is moving to become completely open. The only limit placed on its use is that on human ingenuity, and as long as citizens know where and how to look, this constraint will be insignificant.

Share
Posted in Institutions and Growth | Tagged , , | Comments Off on Open Data and Development

NREGA and rural welfare in India


In the evaluation of social programs, the first order concern is their effect on beneficiaries. However, there is a growing awareness about “spillovers” or “peer effects”, which could affect non-beneficiaries. In Mexican villages where PROGRESA cash transfers were implemented, non-eligible households were more likely to send their children to school. Thanks to transfers and loans from eligible households, their consumption also went up.

This post makes a related, but different point: social programs, especially programs other than cash transfers, may also change the market equilibrium, which affects beneficiaries and non-beneficiaries alike. Workfare programs for example, by providing public employment to beneficiaries, may increase private sector wages. Another example is in kind transfers, which deliver basic commodities at subsidized prices and may decrease market prices.

In 2005, the Indian Parliament passed the National Rural Employment Guarantee Act (NREGA), which entitled each rural household to 100 days of employment on public works per year. There is no eligibility condition, and workers are paid according to each state’s minimum wage legislation. The program was introduced gradually across Indian districts from 2006 to 2009 and rapidly reached a massive scale; in 2012, official sources reported 51 million beneficiary households.

In a new CSAE working paper, we compare districts where NREGA was introduced first to districts where it came into force later to estimate the impact of the program on rural employment and wages. We show that the introduction of the program is correlated with an increase in public employment and an equivalent fall in non-public employment. The daily wage for casual work increases by 5.5%. These effects are concentrated during the first half of the year when most NREGA employment is provided. Independent studies yield similar findings.

We use these estimates to compute the welfare impact of NREGA for households depending on their monthly per capita consumption. We first consider gains from participation in the program and find that the poorest quintiles are more likely to benefit from public employment provision. We also consider the impact of a rise in private sector wages, which may affect all households, and show that it generates substantial welfare gains to the poor (30 to 60% of total welfare gains) and implies a welfare loss for the rich, who are net buyers of labor.

The first conclusion of this study is that equilibrium effects are important, and should be taken into account to evaluate the impact of social programs on beneficiaries and non-beneficiaries. The second conclusion is that through changes in market prices social programs make some people lose: large landholders are unlikely to participate to NREGA but will see their labor costs rise. Governments may want to use these effects to trigger redistribution, but they may also provoke political resistance.

Share
Posted in Institutions and Growth, Jobs, Finance and Skills, Policies to Protect the Poor | Tagged , , , | Comments Off on NREGA and rural welfare in India

Economic shocks and conflict: where is the literature headed?

Photo by the ENOUGH Project, Creative Commons Attribution-NonCommercial-NoDerivs 2.0 Generic License

I received news this weekend that the keynote speech for the upcoming CSAE conference will be on “Conflict, climate and economic development in Africa.” The speaker will be Berkley’s Ted Miguel. If you didn’t have a reason to attend the conference before, you do now!

Spurred in no small part by the pioneering work of Oxford’s own Paul Collier and Anke Hoeffler, the first wave of research into the economics of conflict established that economic variables are good predictors of the incidence of conflict. Economists, then, might have something to say about the causes of war and other types of violence. This, of course, remains an active literature: Djankov and Reynal-Querol, for example, have recently argued that the correlation between poverty and civil war is not causal, but instead reflects the deep underlying causes of both poverty and conflict. Spolaore and Wacziarg have come to the striking conclusion that more genetically similar countries go to war more often, even controlling for  physical distance.

In part because it is easier to make causal claims with panel data, a very active subset of this literature has focused on the role of economic shocks. I have been struck by how much recent theoretical (e.g. Besley and Persson) and empirical (e.g. Dube and Vargas) work has reinforced Collier and Hoeffler’s cost-benefit approach.

Evidence has been published both for and against drought as a cause of civil war in Africa. Similarly, there is controversy whether terms-of-trade shocks have or have not spurred conflict.  As an economic historian, I have to point out that these are not new issues. Ying Bai and James Kai-sing Kung have linked Sino-Nomadic conflict over the very long run to climate shocks. Namrata Kala and I have argued that beneficial temperature shocks increased slave exports during the time of the slave trade.

So: I find this a very interesting literature! Since I am late to the party, I have to make some guesses about where the field is headed if I want to contribute something. As best as I can tell, this field is headed in two directions:

1. Why do shocks precipitate conflict in some places and not others?

The connection between economic shocks and conflict appears to depend on many things. Notably, Kung and Ma have found that the link between droughts and peasant rebellions in historical China was weakened by the intensity of Confucianism. Similarly, Ruixue Jia has argued that the spread of drought-resistant sweet potatoes helped break the link between drought and peasant revolts. Eric Chaney has shown that the link between fluctuations in the Nile flood and political changes in pre-modern Islamic Egypt operated through a very specific set of local institutions. Still, there are many variables that may interfere in the link between economic shocks and conflict.

2. What are the long run effects?

We have learned a lot in the last decade about how living through war affects child soldiers, soccer players, and children who grow up during war, among others. Recent work has shown that war exposure is bad for child health, warps portfolio decisions, and changes how individuals behave, though it may increase political participation. Achyuta Adhvaryu and I will debut a paper in this sub-field at the CSAE conference next month.

At the macro-level, Melissa Dell tells an interesting story of path dependence about the Mexican revolution. Areas experiencing drought on the eve of the revolution were more likely to participate in the insurgency. This translated into greater land reform in these municipalities. Due to the weaknesses of the ejido system, these districts are poorer and less industrial today.

Other studies of the macro-economic effects of conflict, however, have yielded surprising conclusions. Though the temporary disruptions caused by war can be massive, economies prove surprisingly resilient. Hiroshima and Nagasaki returned to their long-run trends within a generation. The intensity with which different parts of Vietnam were bombed during the war are does not predict differences in the extent of poverty. Economies, then, have been quite resilient, as would be predicted by many standard growth models. But, if we believe “new” growth theories, in which human capital matters, this becomes surprising. Here, the micro-economic and macro-economic evidence appears to be out-of-sync.

Share
Posted in Institutions and Growth | Tagged , , | Comments Off on Economic shocks and conflict: where is the literature headed?

Is ethnicity deep?

ethmap

I am teaching a short module in the M.Sc. In Economics for Development this term on “deep roots” of economic development. Enrico Spolaore and Romain Wacziarg provide an excellent summary of this literature here. One half of one of one lecture will be on “ethnicity,” which raises the question – is ethnicity is really something “deep”?

This is important, because there several recent papers suggest that the historical legacies of institutions particular to specific ethnic groups – so-called “ethnic institutions” – matter for real outcomes. A forthcoming paper by Stelios Michalopoulos and Elias Papaioannou and an older paper by Nicola Gennaioli and Ilia Rainer find that parts of Africa with more centralized pre-colonial states have a greater density of night-time lights and better provision of public goods in the present. Elise Huillery, similarly, has linked pre-colonial states to modern outcomes through the degree of hostility to colonial rule. Other ethnic institutions also matter: the Tswana kgotlas that constrained elites before colonial rule may still check their power today. In some cases, these institutions have been transformed under colonial rule, (e.g. chieftaincy in Sierra Leone, land tenure in Ghana), but still matter for present-day outcomes such as investment and public goods. In my own work, I have argued that pre-colonial patterns of land rights predict present-day patterns of land acquisition in Ghana, and that the distribution of polygamy over space in Africa is in part a legacy of pre-colonial ethnic institutions.

So, is ethnicity deeply rooted? A small number of studies have attempted to show that some of the causes of ethnic diversity are very old. Stelios Michalopoulos has found a remarkably robust correlation between geographic heterogeneity and ethnic diversity. Though this is consistent with several theories, he believes it is driven ultimately by specialization; ethnic groups develop subsistence practices adapted to their environments, and these activities come to define them. The diversity in geographic endowments within ethnic homelands also predicts inequality across ethnic groups today. Pelle Ahlerup and Ola Olsson take a different view. Over time, they argue that peripheral members of one group split off as the centre finds providing public goods to be too costly. Though theirs is a primarily theoretical paper, they show that countries that have been inhabited longer by humans are more diverse today. Javier Birchenall argues instead that pathogen stress encouraged isolation in pre-industrial societies, leading to greater diversity over time.  Klaus Demset, Ignacio Ortuño-Ortín and Romain Wacziarg show it is the oldest linguistic cleavages that best predict the onset of conflict in the recent past.

But, strikingly, there is a substantial amount of research showing that ethnicity is malleable. Parts of Africa that were hit harder by the slave trade are more ethnically diverse today, a correlation that holds even when distance from regions of slave demand are used to control for possible reverse-causation. Mahmood Mamdani has famously argued that the identities of “Hutu” and “Tutsi” are ultimately political entities shaped by colonialism. Even where ethnic identities are clear, they are exploited selectively. Africans identify more with their ethnic group relative to their country when elections draw near. When allowed to act anonymously in a lab, Ugandans treat their co-ethnics no better than members of other ethnic groups. Ethnic groups that are adversaries when both are large enough to contest power in one country become allies when they are only minority groups in another country.

Together, these results present something of a puzzle. If “ethnic institutions” matter, we should know where ethnicity comes from, and why it changes.

Share
Posted in Institutions and Growth | Tagged , , , , | 3 Comments

What have we learned from all the agricultural microinsurance pilots?

This blog post is based on a keynote speech given by Daniel Clarke at the 8th International Microinsurance Conference, on 8 November 2012.

Since 2003 there have been a large number of agricultural insurance pilots in low income countries.  Many of these were weather indexed insurance pilots, where the claim payment to policyholders depended only on the weather (rainfall, temperature, etc.) at a nearby weather station.  However, with the notable exception of the Indian Weather Based Crop Insurance Scheme which now covers over 11 million farmers per year, very few of these pilot programs have scaled up.  Why is this and, more broadly, what are the lessons from all these pilots?  This blog post outlines six lessons, and makes tentative suggestions for index insurance product design.

Lesson 1. Agricultural insurance is not a complete solution to agricultural risk (World Bank, 2011)

Agriculture is an uncertain business.  Costs mean that formal sector insurance makes most sense for extreme, low probability shocks; risk retention through savings or credit, or risk sharing with friends and family can be more cost effective for less extreme, more frequent shocks.   Moreover, investments in risk mitigation (e.g. irrigation or flood resistant seeds) are often more cost effective than insurance for fairly frequent events.

Lesson 2. Public sector roles are critical for sustainable scale-up (Mahul and Stutley, 2010)

Many pilots have mainly focused on the private sector role in market for agricultural insurance.  However, successfully scaled-up agricultural insurance programs have typically been public-private partnerships.  Government intervention can be motivated by market imperfections (e.g. index definition and data collection is effectively a natural monopoly in low income countries) or government pro-poor objectives (e.g. agricultural insurance as a market mechanism used to target social objectives).

Lesson 3. Farmers want reliable protection (Clarke 2011a)

Insurance is only attractive if you believe that the insurer will pay when you need it.  For traditional indemnity insurance, insurers know from experience that takeup will be low if there is low trust in the insurance provider or there are too many important exclusions. Doherty and Schlesinger (1990) famously showed that this dislike of contractual nonperformance risk is rational. For indexed insurance, basis risk, the risk that the claim payment does not match the farmers’ loss, provides another reason why the insurance might not pay when it is most needed.  For example, a farmer may lose his or her entire crop due to disease but not receive a claim payment from a weather indexed insurance policy because the weather at the contractual weather station was good.  Basis risk can therefore supress demand, just as other forms of contractual nonperformance can.  How much it will supress rational demand depends on the degree of basis risk.

Lesson 4. Weather index insurance does not (seem to) offer reliable protection for farmers (Clarke et al. 2012)

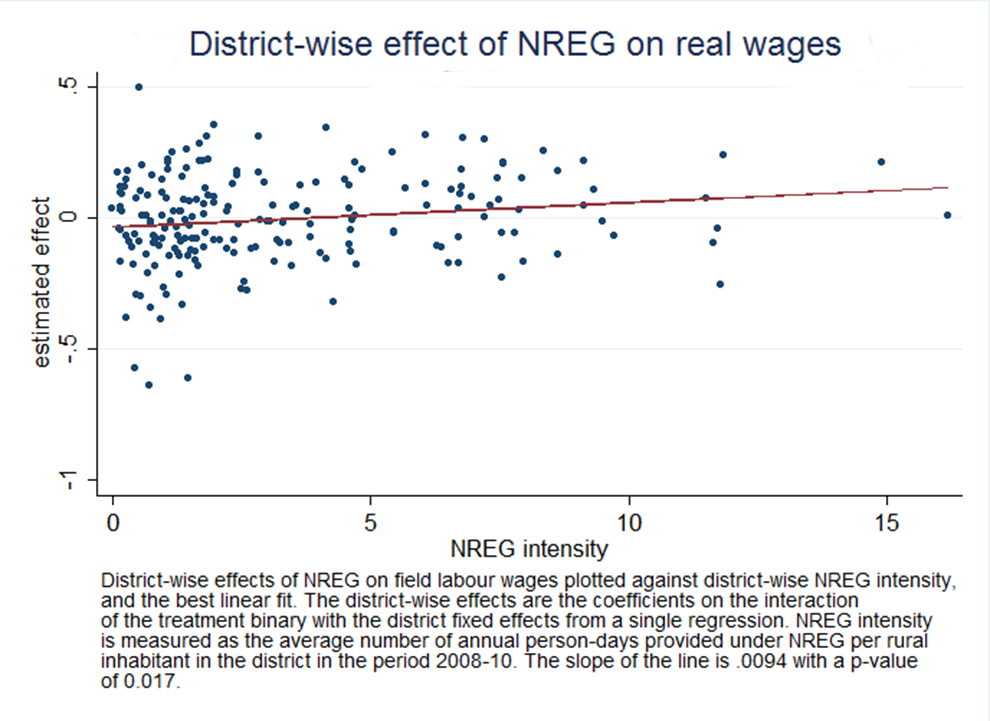
There is currently no convincing statistical evidence from any program suggesting that weather index insurance can be relied on to pay in years that are bad for smallholder farmers.  Whilst statistical analysis of basis risk has not been conducted for most pilot weather index insurance programs, available evidence is very negative.  For example, see the figure for a recent analysis of 9 years of matched weather and yield data for 318 weather index insurance products sold across one Indian state under the WBCIS from Clarke et al. (2012).  The results of this analysis suggest that if yields are twice the long-run average the weather products will pay 6 percent of the sum insured on average whereas if yields are zero the weather products will pay 12 percent of the sum insured on average.  The correlation between area average yields and indexed claim payments is only -13%.  Whilst the yield data is unlikely to be perfect, this is quite a lot lower than we were expecting to find.

This may seem strange.  Weather is clearly important for agriculture, so why is the correlation here so low?  I would suggest three reasons.  First, other perils such as pest, disease, wind, flood, frost, hail, and localised weather can cause catastrophic losses but are typically not well captured by weather indices.  Second, farmer behaviour (e.g. planting date) is typically very difficult to capture in a formula set at the beginning of the season, and this may mean that the weather index insurance contract is particularly sensitive to rainfall over the wrong periods.  Finally, the places in which weather indices have the most convincing rationale are the places with very poor historical yield data.  However, without 30+ years of high quality production data, model calibration is likely to be poor.

Lesson 5. We need better claim payment rules, and mutuality may be a missing link (Clarke 2011b)

Weather index insurance proponents typically separate shocks into two categories: those caused by weather and those not.  I would suggest that a different categorisation might be more helpful, namely splitting large shocks that affect a farmer into shocks that are large, on average, locally (systematic shocks) and those which only affect a small number of farmers (idiosyncratic shocks).  These two kinds of shocks should be addressed differently.

  • Idiosyncratic shocks: The formal sector cannot offer affordable protection for idiosyncratic shocks (individual indemnity insurance suffers from very high moral hazard and high costs), but communities may be able to offer protection against large idiosyncratic shocks through farmer groups, cooperatives, mutuals, etc.
  • Systematic shocks: The formal sector can and should offer reliable protection for large systematic shocks.  Weather or satellite index insurance does not seem to adequately capture aggregate shocks, but area yield (e.g. the Indian modified NAIS) or group multiple peril crop insurance (e.g. Mexican Fondos) may be able to.

Lesson 6. Meso-insurance for lenders has potential (Skees et al. 2007)

By taking agricultural risk away from the balance sheet of lenders, meso-level agricultural insurance could allow lenders to increase their exposure to the agricultural sector without being too exposed to large agricultural shocks.  In turn this could support farmer investments in agricultural productivity (fertiliser, improved seeds).

What does this mean for smallholder farmer index insurance product design?

  • Don’t believe stories, believe data.  Regulators, donors and governments should demand that statistical analysis like that presented in the above figure be presented before any set of index insurance products are offered to people on low incomes.  Insurance for the vulnerable should be safe.  My guess is that most weather or satellite-based agricultural index insurance programs for smallholder farmers are currently not.
  • Offer reliable products, and innovate behind the scenes.  Area yield and area revenue indices are attractive in that they are designed to accurately capture aggregate shocks.  However, it is not a question of yield data or weather data or satellite data; all can be useful.  For example, the Government of India is piloting a modified National Agricultural Insurance Scheme (mNAIS), where the main claim payments to farmers are based on area yield indices but satellite data is used to target and audit crop cutting experiments and weather data may be used for early part-payments.  They are also making innovative use of technology in speeding up and increasing the reliability of crop cutting experiment data (video recording crop cutting experiments with GPS-enabled cell phones, sending data to the insurers in real time, etc).  In countries where audited, manipulation-free crop cutting experiments are not feasible for political economy reasons agricultural insurance for smallholder farmers may not be able to increase welfare.

References:

Clarke, D.J., “A Theory of Rational Demand for Index Insurance,” Department of Economics Discussion Paper Series 572, University of Oxford 2011a.

Clarke, D.J.,, “Reinsuring the Poor: Group Microinsurance Design and Costly State Verification,” Department of Economics Discussion Paper Series 573, University of Oxford 2011b.

Clarke, D.J., K.N. Mahul O. Rao, and N. Verma, “Weather Based Crop Insurance in India,” World Bank Policy Research Working Paper No. 5985, 2012.

Mahul, O. and C.J. Stutley, Government Support to Agricultural Insurance: Challenges and Options for Developing Countries, World Bank Publications, 2010.

Skees, J.R., J. Hartell, and A.G. Murphy “Using index-based risk transfer products to facilitate micro lending in Peru and Vietnam,” American Journal of Agricultural Economics, 2007, 89 (5), 1255–1261.

World Bank, “Weather index insurance for agriculture: Guidance for Development Practitioners,” Agriculture and Rural Development Discussion Paper 50, 2011.


Share
Posted in Institutions and Growth, Policies to Protect the Poor | Tagged , , , , | 1 Comment

The rise and fall of (Chinese) African apparel exports

Even the tiniest signs of industrial take-off in Africa always attract the attention of economists and policymakers, both of whom are eagerly waiting for the elusive African growth miracle. One such episode of excitement was the surge of apparel exports that followed the implementation of the African Growth and Opportunity Act (AGOA) by the US in October 2000.

AGOA, which enabled some African countries to export over 4,000 products, including hundreds of apparel products, quota-free and duty-free to the US, is widely regarded as a trade-policy success. Yet the export surge has not survived the 2005 demise of the Multifibre Agreement, when Chinese exports, no longer facing US quotas, took over, and has not been accompanied by dynamic growth benefits. As seen in Figure 1, exports from AGOA’s three most successful exporters as well as AGOA as a whole peaked in 2004 and it was all downhill after that.

Figure 1 - the rise and fall of African apparel exports

In recent research with Lorenzo Rotunno and Zheng Wang (Rotunno et al. 2012) we argue the success was rapid but short-lived as a large share of AGOA exports were in fact Chinese exports transhipped through AGOA to circumvent now-abolished US quotas and on top benefit from duty-free treatment.

How US trade polices inadvertently turned Africa into a trade corridor for China

The quotas imposed on Chinese exports during the Multifibre Agreement guaranteed smaller developing countries access to the US market. This implicit export subsidy for African countries, coupled with AGOA preferences, was thus a golden opportunity for African apparel exporters.

Yet, a key feature of the AGOA preferences was the absence of rules of origin, which are usually imposed under trade agreements to avoid transhipment. This meant that African exporters could use inputs from any country, in any proportion, as long as some assembly work took place in Africa. It thus provided an opportunity for Chinese exporters to merely tranship their products via “screwdriver plants” in Africa, avoiding US quotas and on top benefitting from AGOA preferences. The end of the quotas on Chinese exports rendered the transhipment unnecessary and thus led to the departure of footloose factories and the fall of AGOA exports.

The Chinese wave in Africa

The suspicion that AGOA and US quotas on Chinese exports spurred a Chinese manufacturing wave in Africa has been all over the news. Chinese and Taiwanese producers formed the bulk of a textile “diaspora” in Lesotho, Madagascar, and Kenya. In the Kenyan Export Processing Zone, 80% of the 34 garment plants had Asian owners. What’s more, the inputs of apparel firms in Africa were most-often Chinese. For example, Lesotho firms typically provide assembly, packaging and shipping services and depend on their Asian headquarters to send them the fabric they need.

Tracing transhipment

We go further than the anecdotal evidence by empirically tracing the transhipment from China to the US via Africa. More precisely, we show that Chinese apparel exports to AGOA countries predict these countries’ exports to the US. To show that this correlation, which we label transhipment elasticity, indeed captures transhipment, we show it only holds in countries which didn’t face any rules of origin within AGOA, and only for products bound by US quotas on Chinese exports. In other words we find traces of transhipment only where incentives were highest, i.e. in quota-bound products, and in countries where it was legally possible to do so.

This is illustrated in Figure 2 which shows how the transhipment elasticity varies with the quota fill rates, a measure of quota bindingness, and across countries. In countries not facing any rules of origin, i.e. where transhipment was possible, we find a positive elasticity that increases significantly with the bindingness of the quotas (blue line). But in AGOA countries non-eligible for the apparel provision, or in those facing rules of origin, such as in apparel-exporting South Africa and Mauritius, we find no significant transhipment elasticity (red line).

Figure 2: Transhipment elasticities

Policy implications

In a nutshell, our research provides evidence on the unintended consequences of economic policies, here the transhipment that resulted from the combination of US quotas against China and unrestricted preferences for Africa. This transhipment explains the surprisingly fast and robust impact AGOA had on apparel exports to the US. Back-of-the-envelope calculations suggest that the policy combination may account for as much as 64% of Botswana’s apparel exports, 45% of Kenya’s, 35% of Madagascar’s, and 23% of Lesotho’s.

Yet this rapid rise and fall warns that supply-chain industrialisation may lead to fast growth but can have limited spillovers and comes with the risk of further re-locations of production. Development-focused trade policies should thus pay special attention to the fickleness of production fragmentation.

Share
Posted in Institutions and Growth, Jobs, Finance and Skills, Policies to Protect the Poor | Tagged , , | Comments Off on The rise and fall of (Chinese) African apparel exports

What comes after the Millennium Development Goals?

In 2000 the United Nations adopted the Millennium Development Declaration, which committed their members to a new global partnership to tackle poverty and other development challenges. In 2005, under the leadership of Jeffrey Sachs, a number of time-bound targets were developed – they have become known as the Millennium Development Goals (MDGs). As the 2015 deadline looms, it is time to reflect on the usefulness of the MDGs and to think of new development guidelines.

As a reminder, there are eight MDGs and the UN monitors their progress based on 21 targets, measured by 60 variables. The latest UN report indicates that remarkable progress has been made, with four targets having already been met: extreme poverty and the proportion of people without access to safe water has been halved, lives for slum dwellers have improved and there is now parity in primary education between boys and girls.

However, progress around the world is uneven. While China, India, Indonesia and Vietnam have experienced high growth rates, a reduction in poverty and improvements in living standards, other countries have seen far less progress. The majority of Sub-Saharan African countries will miss most of the targets. Worldwide, none of the fragile states will achieve a single MDG. Despite the progress in reducing extreme poverty, about 1 billion people will still be living on less than $1.25 a day in 2015. Eighty percent of these extremely poor people will be Africans. Other targets, such as hunger, infant mortality, maternal mortality and communicable diseases are unlikely to be met globally by the deadline.

Thus, we are still facing huge development challenges. How should we respond? Should we continue to use the MDGs as our measure of development progress, consider a ‘MDGs plus’ or develop a new framework altogether? I believe that the MDGs have focused the attention of rich countries’ on the plight of the poor around the world and helped to build a constituency for change. While many SSA countries have made progress, historical comparisons suggest that the MDGs were overly-ambitious, given the low levels these countries started at. In order to maintain momentum we should continue monitoring development targets but also move to revise some to reflect achievable goals for the countries that have made the least progress. I fear that, without a revision for SSA countries, the international community might disengage when they recognise that these targets cannot be achieved. Fragile states across the globe should also be given additional consideration: we need a better understanding of the impact of political, technical, financial and military support and combine these resources to assist in stabilization.

Another aspect of the MDGs as a development framework that has received little attention is how to prioritize resources across time to maximize gains. We now have a wealth of micro studies revealing which interventions work in a large number of countries. Some interventions are more cost effective in the pursuit of development goals. For example, the comparisons within the Copenhagen Consensus project show that health interventions have the best benefit-cost ratio: rehydration drugs are cheap and save children’s lives and vaccinations drastically reduce infant mortality. These lifesaving technologies exist but are currently not affordable for the poor. Thus, it is largely not a problem of technology but affordability. In the longer term the hope is that countries grow out of poverty and build health care systems able to deliver these primary health services without support from donors.

Continue reading

Share
Posted in Institutions and Growth, Policies to Protect the Poor | Tagged , , , | 1 Comment

White man’s burden? How the presence of foreigners can change behaviour

In my fieldwork in Sierra Leone I often find myself in an uncomfortable position where I receive “special treatment” because of my identity. This is an experience shared by researchers and expat aid workers who try, but fail, to “fit in”. The sad truth is that foreign development researchers and practitioners bring with them a whole set of perceptions and expectations. These expectations lead to different behaviour, which could be a hindrance to good research and good development practice. But how do people act differently? And why?

Our research team, Oeindrila Dube and Bilal Siddiqi and I, randomly varied the identity of a field researcher helping administer dictator games in Sierra Leone. The researchers were both male and of similar age and educational attainment. One was a white American and the other was a local Sierra Leonean. Neither spoke a word during the experiment. We found that participants acted more generously – an average increase in giving of 20% – in villages where the white researcher was present.

Why would participants act differently in the presence of a white man? To unpack potential mechanisms we look at how different people and communities respond differently to the presence of a white man. First, respondents from villages that are more exposed to aid are less responsive to the presence. This suggests that different levels of giving have something to do with expectations about aid. Participants from these villages possibly expect less from foreign visitors, since they have a better idea of how aid is allocated. Second, we find that respondents who hold a traditional position of power – chiefs and leaders of secret societies – actually gave less in the presence of a white man. Increased giving by those with less power could thus be due to deference to authority, based on perceptions of power of the white man.

These results have implications for research and development practice. First, your presence in the research significantly undermines the results. You should either be absent when games and surveys are conducted, or randomly vary your presence. The success of impact evaluations could thus be overstated, if respondents “give the right answers” to please the researcher.  Moreover, true behavioural change could be short-lived if it is determined by the presence of a “white man”, rather than the actual project. Second, development practice could be more difficult than initially thought. All development agencies emphasise “equal partnerships” with local organisations and “empowerment” of the recipients of aid. But this research suggests that this goal is very hard to realise, due to initial asymmetric power relations. If we are associated with power and money, isn’t our mere presence disempowering?

Share
Posted in Institutions and Growth, Policies to Protect the Poor | Tagged , | 1 Comment

Can large-scale public works programmes push up wages?

Most of the world’s poor live in rural areas, and at the bottom of the pyramid are landless workers subsisting on casual wage labour in agriculture. Policies that can put upward pressure on agricultural wages are therefore likely to be some of the most effective ways of improving the welfare of the poorest people on the planet.

In principle this could be achieved by introducing minimum wages, but enforcing a minimum wage rate is unrealistic in most developing countries. On the other hand, public works, which typically employ large numbers of unskilled workers to improve public infrastructure, may push wages up. If so, the welfare effects of public works programmes would reach well beyond the people who are directly employed by them.

In recent research, we look at a large-scale public works programme: the Indian government’s National Rural Employment Guarantee (NREG). NREG is an enormous programme by any standard: in the financial year 2010–11, it generated 2.57 billion person-days of employment. It is therefore of considerable interest in its own right. Yet the size also implies that the scheme, notwithstanding the many problems in its implementation, is eminently scalable. Evaluations of small pilot schemes are often criticised on the basis that the observed effects may not be reproducible at larger scales. That critique does not apply here, and the lessons learned should be of broad interest.

The scheme was introduced across India’s 600-odd districts in three distinct phases, allowing us to identify a difference-in-difference-type estimator. Using a decade’s worth of wage data for 250 Indian districts, we find that for each person-day of employment generated by NREG per capita in a district, agricultural wage rates increased by 1.6 per cent. Since NREG generates approximately 3.3 person-days of employment per person per year on average, the implication is that the programme boosted real daily wages in India by 1.6×3.3=5.3 per cent.

In principle, there are two ways in which a large-scale public employment programme can influence market wages. The first is by shifting up the demand curve for labour, thereby increasing its equilibrium price. The second is that the public goods generated by the programme may increase labour productivity and thus wages. We are not able to separate these two effects econometrically, but we concur with a recent World Bank report stating that ‘the objective of asset creation runs a very distant second to the primary objective of employment generation.’ Our impression is that in reality, the infrastructure built under NREG is often of low quality and unlikely to raise local productivity by much.

As mentioned, NREG was implemented across India’s rural district in three phases. The poorest districts received the programme first, and the better-off districts, last. We find that the effect of the programme on wages is strongest in phase I and II districts, and not significant in phase III districts. This may be because wage rates in phase I and II districts were generally lower than phase III districts before the programme was introduced. Since the statutory NREG wage rates are equal across all districts in a state, they are likely to exert the most upward pressure in the poorest districts.

Even though the effect on wages is significant in every month of the year, we find that the magnitude is smallest in the agriculturally slack months of March and April. Private-sector demand for labour is low in these months, and the extra slack in the market may reduce the effect of NREG’s labour demand shift on wages.

Clearly, an increase in wage rates is not a Pareto improvement. The other side of the coin is that landowners and other rural employers face higher labour costs. However, this objection does not stop governments around the world from trying to impose minimum wages rates, another market intervention aiming to favour workers. Public works programmes provide governments with an additional mechanism with which to influence wage rates in the rural unskilled labour market. Since the link between agricultural wages and poverty rates are well established, if public works can influence agricultural wages then they constitute an attractive policy instrument to reduce poverty.

For more information, you can find the working paper here (written with Sambit Bhattacharyya, Rajasekhar Durgam and Manjula Ramachandra).

Share
Posted in Jobs, Finance and Skills, Policies to Protect the Poor | Tagged , , , | Comments Off on Can large-scale public works programmes push up wages?