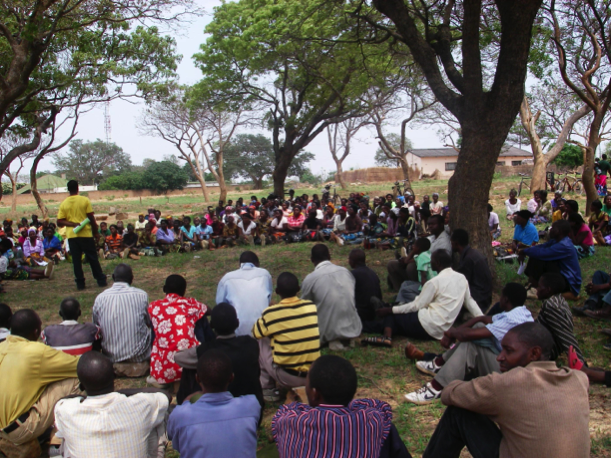
President of Burundi Pierre Nkurunziza visits South Africa, 3-4 Nov 2014 (photo credit: GovernmentZA).
When president Nkurunziza announced his intention to run for a third term, serious unrest exploded in the streets of Bujumbura. In the last three weeks, violent clashes with the police have triggered fears of a new civil war and destabilisation of the entire African Great Lakes region. So far, the international community has been unable to calm the situation and over 110,000 Burundians have already fled the country. The Oxford Central Africa Forum hosted a round-table on the 15th of May to examine the causes of the current situation and discuss the prospects for peace and democracy in Burundi and the region. It gathered six researchers who have conducted fieldwork in Burundi:
- Professor Patricia Daley, School of Geography and the Environment [PD]
- Dr Andrea Purdekova, African Studies Centre [AP]
- Dr Olivier Sterck, Centre for the Study of African Economies [OS]
- Rowan Popplewell, School of Geography and the Environment [RP]
- Jean-Benoît Falisse, Department of International Development [JBF]
- Benjamin Chemouni, Department of International Development, London School of Economics [BC]
This blog post presents some of their analysis and findings. This blog post is organized in three section. First, we explore the forces present on the ground. In the second part, we discuss the role of local grievances, ethnicity, and the economy in the conflict. In the last part, we discuss regional implications of the crisis.
The Burundi crisis: (local) forces in presence
The power balance between the forces present on the ground is obviously a key determinant in the current crisis. In this first section, the panellists sought to better understand some of the key forces in current crisis and address, among others, the following questions: Who are the protesters? What is the political opposition doing and how is it different from the civil society? What is the role of the army and the police?
So far most of the protests have been concentrated in Bujumbura, with a few incidents reported in the Mugamba region and in Burundi’s second city, Gitega. The protesters mostly come from the city but they have included both Hutu and Tutsi, a lot of young people and students and also, on some days, women and middle-aged people. Virtually all the neighbourhoods (communes) of Bujumbura have been affected, with particularly explosive situations in Musaga, Cibitoke, and Nyakabiga. The situation in the countryside is harder to analyse, especially since a prime source of information, the independent media, has been shut down by the government and their facilities were destroyed during the coup attempt. Historically, Pierre Nkurunziza and the CNDD-FDD have had a strong support in the countryside, and since the beginning of the protests the government has maintained that “99% of the country is peaceful”. Yet, the 110,000 Burundians who have fled the country are mostly not from Bujumbura, which seems to indicate that the situation is also very tense, and potentially violent, in the countryside. Efforts to map the current violence show a few incidents in the countryside as well. [JBF]
The political landscape is fragmented. The CNDD-FDD (National Council for the Defence of Democracy/Forced for the Defence of Democracy) historically had most of its votes from rural areas, as shows the map of the results of the 2010 municipal elections. The support for Pierre Nkurunziza and the CNDD-FDD was overwhelming in most of the country. There was also, during these elections, a strong and clear link between support for CNDD-FDD and the presence of demobilized ex-combatants from CNDD-FDD (correlation is 0.6). [OS]

(1) Demobilized ex-rebels returns

(2) Results of the 2010 municipal elections
Contrary to the CNDD-FDD, the support for opposition parties (FNL, FRODEBU, UPRONA and MSD) in 2010 was concentrated in Bujumbura Mairie and in the South West of the country. During the last elections, many opposition parties boycotted the presidential and parliamentary election, denouncing massive electoral fraud during the municipal elections and claiming that municipal elections were not free and fair and the next polls unlikely to be so. This strategy has proved disastrous for them as the CNDD-FDD consolidated its control over all state institutions. Pierre Nkurunziza has been travelling very frequently to rural areas, and seems may have preserved his advantage there, where he used to be very popular. Over the past ten years, the CNDD-FDD has created an impressive network of socio-economic associations, party buildings and “office hours” (permanences) in the countryside.
The opposition parties face several barriers that may prevent them to gain the support they need to become a more visible force of the Burundi society, especially in the countryside. Firstly, they lack funding -and the ruling party has secured the control of key resources. Secondly, they are the victims of alleged repression in the form of arbitrary detention and violence, as evidenced by recent UN and NGO reports. Thirdly, recent laws limit the possibilities of the opposition. For instance, a 2012 law determines fines and prison sentences against opposition leaders guilty of “falsehood or slander with the intention to disturb peace and security”. Another law also prohibits the formation of coalition outside periods of electoral campaigning, and yet another law states that “organizations should notice four days in advance to local authorities if they plan a demonstration of a party meeting. These can be cancelled or forbidden unilaterally if there is a risk to disturb public order”. In sum, it seems complicated to see a strong opposition emerge in such a fragmented and repressive landscape. [OS]
The CNDD-FDD used to be a complex political animal, with its different internal factions sharing and disputing power. The recent stance of senior party members against the third mandate has led to the exclusion of most dissident voices and the Nkurunziza camp establishing its dominance over the party apparatus. The practice of exclusion of dissident voices is not new for CNDD-FDD. After the 2005 election already, the fractious CNDD/FDD expelled party members who might have posed a challenge to the presidency. The party split following the arrest and imprisonment of party leader, Hassan Radjabu – a key strategist in the civil war – divided members, leading to key figures, such as Alice Nzomukunda and Pascaline Kampayano deserting the party and forming new offshoot parties. In 2007, Radjabu was sentenced to 13 years imprisonment for treason, but ‘escaped’ from prison in March 2015. How much people will differentiate the party from Mr. Nkurunziza remains a question. [JBF & PD]
The civil society has been at the forefront of protests, which emerged against a backdrop of rising tensions with the Burundian Government. They helped to bring people onto the streets, successfully tapping into widespread public anger over recent events, as well as long-term frustrations generated by sustained political and economic marginalisation and ongoing human rights violations. The Government responded by temporarily detaining one civil society leader and issuing arrest warrants for other activists. Although leaders of the civil society campaign against the third mandate publically condemned the coup, they called for protests to continue. However it is important to note that only a small proportion of civil society groups are involved in the protests; namely those groups that are based in Bujumbura who are focused on governance and human rights issues and regard themselves as watchdog responsible for holding the government to account. In a country where political opposition is weak and fragmented, these civil society groups are often regarded as the de-facto political opposition. Their involvement in recent protests, alongside members of opposition parties and their youth militias, will do little to challenge this perception among Government supporters. [RP]
A key factor affecting whether the country descends into more violence is the role in the current violence of the Police, the ruling party’s youth militia (imbonerakure) and the SNR (National Intelligence Service), as well as that of the more equally ethnically divided military. The Police were the instrument of repression before and after the 2010 elections and seemed to be playing the same role in the contemporary period. The SNR was also used repressively, and has also been used to root out opposition to the President among Hutus in Burundi and in the diaspora in neighbouring countries. The fact that Nkurunziza’s office was able to denounce the coup whilst he was still in Tanzania and stated that security forces were looking for the perpetrators, suggests that the SNR is far more resourced and effective than in the past. This is partly due to the training they would have received as part of Burundi’s contribution to international peace-keeping missions. [PD]
During the 2010 elections, the imbonerakure were already active in the intimidation of opposition candidates and their supporters. Since the ville morte days of the mid-1990s, Burundi’s youth have been mobilized by political parties to perpetrate political violence. Reports suggest that the imbonerakure are armed and the flight of over 110,000 Burundians to neighbouring countries is partly a consequence of the intimidation being carried out by the youth militia. Fifty per cent of Burundi’s population is under 17 years. Rates of youth unemployment are high at around 80 per cent. Consequently, unemployed and disaffected youth are drawn into complex patronage relationship with political officeholders and are easily mobilized into youth wings of political parties. [PD]
The military is well trained and better armed due to Burundi having the highest military expenditure of any country in the East African region and support from the US and Belgium; over 2.39% of Burundi’s 2012 Gross Domestic Product. In effect, the military is more professional and its level of ethnic integration (50/50 Hutu/Tutsi) means that it is likely to take a less divisive stance, unless non-sectarian senior officers are removed. Following the Arusha agreement and the demobilization, the army has been heavily transformed. Its composition is more or less balanced in terms of belonging to former rebel groups. Efforts have been made to transform the army into a professional corps which, according to the Arusha agreement, should remain neutral: “the members of the new force are prohibited from taking part in any political activities or demonstrations”. These transformations have been successful in improving the image of the army. In comparison, the police and the intelligence service are perceived as untrustworthy institutions controlled by the CNDD-FDD. [PD & OS]
Local Grievances, Ethnicity, and the Economy.
The question of the constitutionality of a third term is absolutely central in the present crisis. The protesters have repeated their view that the constitution does not allow for a third term and expressed their fear of a carving up of the 2000 Arusha Peace agreement. The issues around the third term and Arusha have been widely discussed in the media and other essays. The roundtable tried to take a slightly different viewpoint and explored the key issues of the present crisis beyond the question of the third term: local grievances and post-war reconciliation and integration, the economy (and especially agriculture and aid), and whether the “ethnic factor” is still relevant.
Even well before the election, there has been a palpable discontent with the government on a number of issues. There is no question that the Arusha peace agreement brought in a profound political change. The power sharing agreement changed the historical ethnic composition of government and ended the exclusion of Hutu from politics. Despite this landmark change in representation and the composition of government, local narratives are profoundly about continuity rather than change, taking issues with the very notion of ‘transition’. Fieldwork conducted in 2013 found that people even question the very notion of ‘peace’, repeatedly highlighting that Burundi has only ‘a little bit of peace’ or no peace at all. People’s notion of security expands beyond physical security, to material security and survival, and hence to economic concerns, prime amongst which is access to land. The story of continuity also ties to perceptions of impunity – no one in Burundi has thus far been prosecuted for political murder-, to lack of progress on questions of justice and memory, lack of trust in the newly established Truth and Reconciliation Commission (which interestingly only appeared on the scene months before the election, in December 2014), and perceptions of corruption, abuse of office, the sense of being ‘used’ by those in authority (people speak of being their “bridge” to other objectives). [AP]
The land issue is an explosive one, but again does not affect all parts of Burundi equally. Bururi province is particularly affected (and the soon to be province of Rumonge) as well as Makamba. These are the areas that produced the majority of refugees in 1972 and that in turn saw the largest inflow of returnees after the war. Most came back only to find their lands occupied. Instead of the promised recovery of their lands, many had to strike land-sharing agreements as an interim measure. The size of this problem is far from negligible (around half a million people returned after the war.) and it is also an open and unresolved issue. The CNTB (The National Land Commission), established in 2006, the very institution meant to resolve the land conflict, has recently fuelled it further. Under the controversial leadership of Serapion Bambonanire, many returnees were awarded the land in full, effectively pushing the “residents” out without compensation. This has resulted in stand-offs and fights on a number of hills, and in the deterioration in community relations at an already tense time (Since then the CNTB has been suspended, and Bambonanire sacked). [AP]
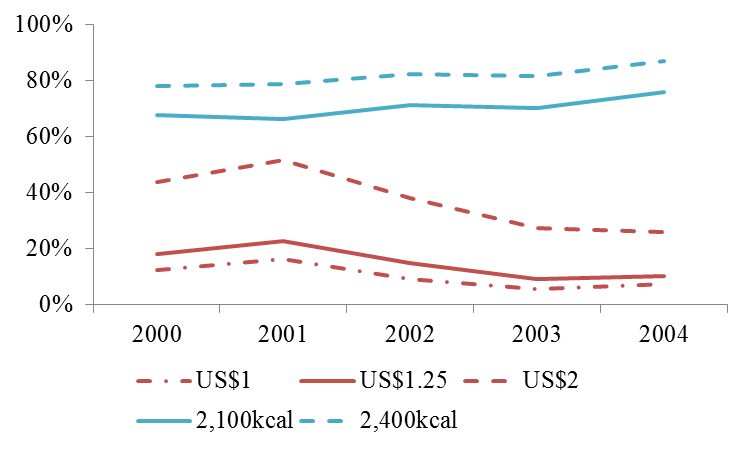
Burundi’s population overly relies on agriculture, which employs around 90% of the population. The Burundian performance in agricultural production since the end of the war is dismal. Food production barely keeps up with population growth. As a result, food prices are constantly increasing, feeding the general inflation that has regularly exceeded ten percent since the end of the war. The second consequence is that child malnutrition is the third highest in the world. Burundi has also the highest score on the Global Hunger Index. The roots of this problem are mainly political. Comparing to neighbouring Rwanda, whose food production is in a much better state, Burundi has more conducive ecological conditions for agriculture, such as vast plains. Yet, corruption and patronage undermine efforts to boost production. For instance, the sector of improved seeds and mineral fertilizers have been important sites of rent capture for individuals close to the ruling party. [BC]
The rest of the Burundian economy struggles to develop and few industries have been built since 2005. Burundi is lagging far behind its neighbour Rwanda, which has a similar size, population, and natural resources endowments (very few minerals, but tea and coffee). The apparently decent 4-5% GDP growth rate of Burundi in the past few years is unlikely to help rapidly alleviate poverty when once the very fast population growth rate is added to the equation. In 2013, international aid amounted to 20% of the GDP and 49% of budget (World Bank). Rampant corruption at all levels has been denounced by the protesters and is visible in ostentatious villas and cars in Bujumbura. Burundi ranked 159 out of 175 in the 2014 Transparency International Corruption Perception Index. A recent Gallup survey found that 38% of the Burundian population is “suffering”, and another 58% is “struggling”. Between 2009 and 2014, the proportion of people who find that the economy is getting worse has increased from 51% to 72%. [JBF]

The current crisis is worsening the economic situation and seriously endangers the ambitious –and often popular- social programmes launched by the president in the past ten years such as the exemption of health-care user fees from pregnant mothers and children below five, free schools, a reform of primary school, and a new health insurance scheme. Key donors (Belgium, EU, USA, the Netherlands, Germany) have already frozen aid programmes and threatened to pull out totally if the situation continues to deteriorate. [JBF]
Ethnicity failed to rear its head in the 2010 elections, with hardly any political opponents using the discourse of ethnicity during the campaign. The exception was Pasteur Habimana (from a small party – FNL-Iragi rya Gahutu) who, whilst campaigning in Rumonge Commune, Bururi Province, called on Hutus to ‘stop Tutsis from ever returning to power’. He was, apparently, condemned by the main Hutu-dominated parties. In popular discourse extremist Hutus hold the view that Tutsis still retain power, despite Hutu dominance in government. So far, the conflict is not framed in ethnic terms, for two main reasons:
Firstly, ethnic divisions do not necessarily overlap with political divisions, which are at the epicentre of the current crisis. The leader of the failed May 2015 coup, Major-General Godefroid Niyombare, is a Hutu and a former member of Nkurunziza’s rebel group and CNDD/FDD. He and other prominent party members were expelled by Nkurunziza from the party in February 2015 for criticizing his bid to run for a third term (Niyombare seems to have escaped capture but his Tutsi collaborators have been arrested). Yet, political in-fighting within CNDD/FDD and its contestation with FNL (the National Liberation Front) suggest that ethnicity is not the fault line that it was in the past. The bulk of political violence against other parties since the end of the war was towards the FNL, a Hutu-dominated party (and more recently against MSD). It is useful to note that historically (and more recently, by virtue of the constitution), Burundi’s political parties have always been multi-ethnic, drawing on regional alliances. This did not prevent most of them from operating in the interest of the ethnic group that dominated the party. For example, the longest ruling party in Burundi’s history, the Union for National Progress (UPRONA), was always seen as a Tutsi-dominated party with Hutu members. In the same vein, one could argue that the ruling party, CNDD-FDD and its main opposition FNL are predominantly Hutu parties with representations from other groups. Cross-ethnic alliances are more meaningful on the ground and, therefore, stronger among the poor urban and rural communities.
Secondly, the fact that the ruling CNDD-FDD is a Hutu-dominated party went a long way in fighting the ethnic prejudice of the eternal Tutsi exploiter. It has showed the Hutu majority of the population that Hutu can also exploit Hutu. Yet, it is not to say that ethnic conflict could not erupt if violence goes on. The Tutsi, by the simple fact of being a minority, may bear the brunt of violence as a group, following the Swahili proverb that “when elephants fight the grass gets hurt”. Tutsi could become an easy scapegoat – part of them are indeed opposed to the president and Tutsi are known to be very present in Bujumbura. What is worrying about the recent political violence in Bujumbura is that a very visible part of it has been occurring in areas of the city that used to be predominantly Tutsi, in the neighbourhoods of Ngagara, Cibitoke, Musaga, Nyakabiga and Mutakura – and that this might be used by unscrupulous politicians as evidence of an ethnicized opposition to Nkurunziza’s regime. [PD & BC]
Regional Implications
The important attention the Burundi crisis has received from the international media shows not only concerns with the safety and future of millions of Burundians but also fears of a regional contagion. Among the key questions are the regional support of president Nkurunziza, the likelihood of a foreign intervention, the lessons for the power-sharing model of peace-building Burundi incarnated, and possibilities for regional and national actors to solve the crisis.
Nkuruniziza would not have been able to return to Burundi after the May 13th attempted coup without some support of the East African states and the international community. For them, stability in Burundi is paramount for three reasons. Firstly, because of Burundi’s role in the AMISOM (African Union Mission in Somalia) – providing 5n542 troops to the peace-keeping force in Somalia. Civil war in Burundi would lead to the immediate de-legitimization of the peace-force. Since 2005, the deaths of Burundians, however small the number, have been tolerated because of the grander project – the war against Al Shabaab. Secondly, the East African political elite were seeking to strengthen economic links across the region with Bujumbura as an important hub for resource flows. And finally, heads of states in the region are also seeking third terms and Nkurunziza’ success will legitimize and enforce their bid among their electorates. Burundi is a first out of a string of key elections in the Great Lakes Region. 2016 is election year in the DRC and in 2017 eyes will be pinned on Rwanda. The Burundi elections will serve as litmus tests of democratisation (are incumbents willing to give up power?) and the depth of peace (can elections proceed without instability and violence?). Burundi’s fragile peace is at stake, and that of the region more broadly. [PD & AP]
With regard to Burundi’s neighbour Rwanda more specifically, there are two key questions that arise: What does the 2015 election in Burundi mean with regard to Kagame’s potential bid for a third term in 2017? Will Rwanda seek to intervene in Burundi if things escalate further? On the first point, it is interesting to observe Kagame’s rhetoric on Burundi, and the role of the framing of the crisis that he deploys. “If your own citizens tell you we don’t want you,” he suggested recently, “how do you say I am staying whether you want me or not?” Nonetheless Kagame repeatedly underlines that the crisis is not really about the third term, it is about “delivery” (referencing Nkurunziza’s delivery to his people). In this manner, he is effectively sidelining or subsuming constitutionality to performance. Importantly, Rwanda’s political space is more tightly controlled than that in Burundi and it is very unlikely that we will see weeks of protest action in the streets. Opposition will be less visible, and internal pressure thus less pronounced. [AP]
Rwanda is certainly watching the situation in Burundi closely, and not only from the outside. There is talk of Rwandan presence in the form of spies and most recently, Antoine Masozera, the manager of Econet, was given 48 hours to leave the country on accusation of espionage. Will Rwanda seek to intervene militarily? While this is not impending, the official discourse in Rwanda is keeping that possibility open. Rwanda has already expressed concerns that the FDLR might take the advantage of the current situation in Burundi and destabilize Rwanda, which could help legitimise a pre-emptive intervention. There has been talk also of the FDLR joining forces with the Imbonerakure; an allegation that the Burundi government has officially denied. Another issue that could open the door to Rwandan intervention is the perceived threat of ethnic violence. The Rwandans have expressed fears that the Imbonerakure are receiving training directly from the FDLR, are being ‘brainwashed’ with genocidal ideology, and that anti-Tutsi leaflets are being circulated in the North of the country. Rwanda’s Minister of Foreign Affairs Louise Mushikiwabo said quite openly that “while we respect Burundi’s sovereignty in addressing internal matters, Rwanda considers the safety of innocent populations as a regional and international responsibility.” [AP]
It is now incumbent on the African Union and the international community to persuade or put pressure on Nkurunziza not to take revenge against the demonstrators or coup plotters (both are from different constituencies), and to respect the Arusha agreement by stepping down, postponing the elections, and allowing democratic process to function. A peace-keeping force made up of West Africans would provide the space for mediation to take place between the various political actors in Burundi. It would be tragic if the region and the international community were to stand by and watch Burundians killed as they demonstrate for their democratic rights, the country disintegrates into civil war, and ethnicity used instrumentally by unscrupulous politicians. [PD]
Burundi is a unique case on which to judge what power-sharing mechanisms can and cannot achieve in what Arend Lijphart termed as ‘deeply divided’ societies. After the civil war, Burundi implemented a complex scheme of consociational power-sharing, carefully instituting ethnic proportionality at all levels of the government. But what have been the effects of power-sharing with regards to salience of ethnicity, democratization and stability? To begin with, and despite what some critics would have predicted, the saliency of ethnicity in politics has diminished. On the other hand, power-sharing has prevented neither a gradual democratic backsliding with every progressive election, the current one notwithstanding, nor insecurity and destabilization. As Stef Vandeginste has previously argued, power-sharing in Burundi can be considered at most a ‘fragile safety valve,’ to some extent limiting but ultimately not preventing the consolidation of power in the hands of the dominant party. Power-sharing thus cannot guarantee, in itself, sustainable democratisation or long-term stability. The latter issue is closely related to the former, as the current crisis clearly demonstrates. [AP]
Despite the successful ethnic re-fashioning of power in Burundi in the past 15 years, a deeper change is necessary, one which includes but goes beyond free and fair political competition. What is needed is a more credible break with past styles of power and ways of relating to the society at the local level, a government able to directly address past injustice and core grievances today. [AP]
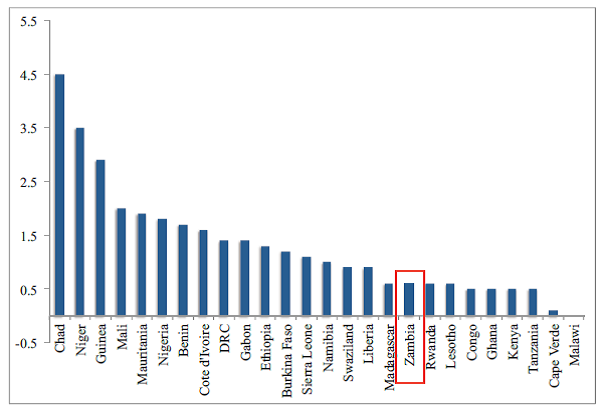
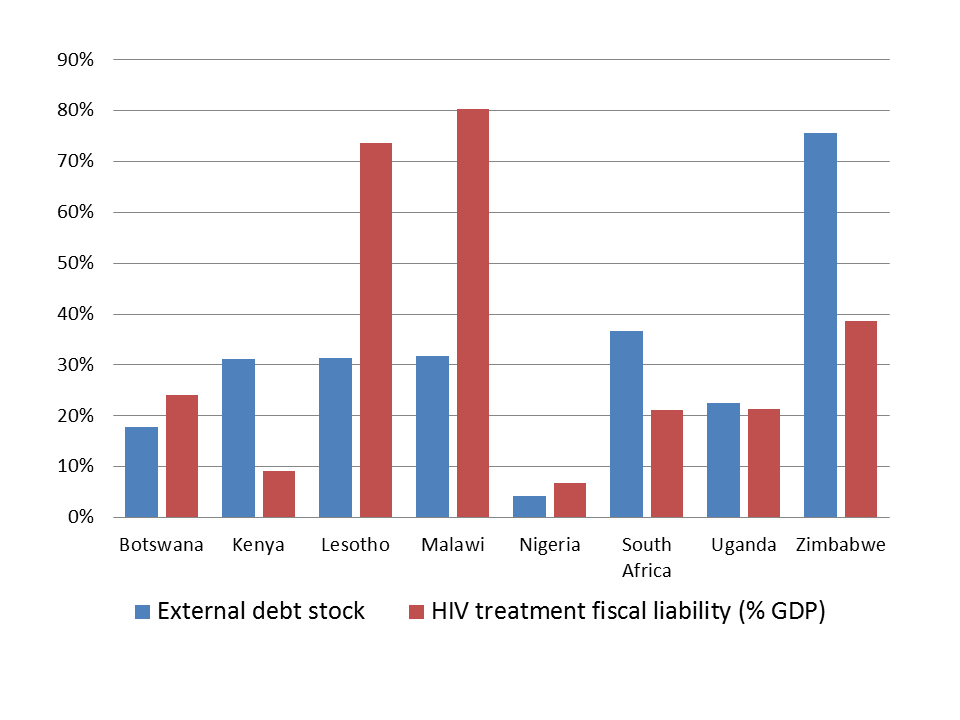 Figure 1: Discounted total cost of full ART coverage (350 cells/mm3) and external debt stock in 8 countries
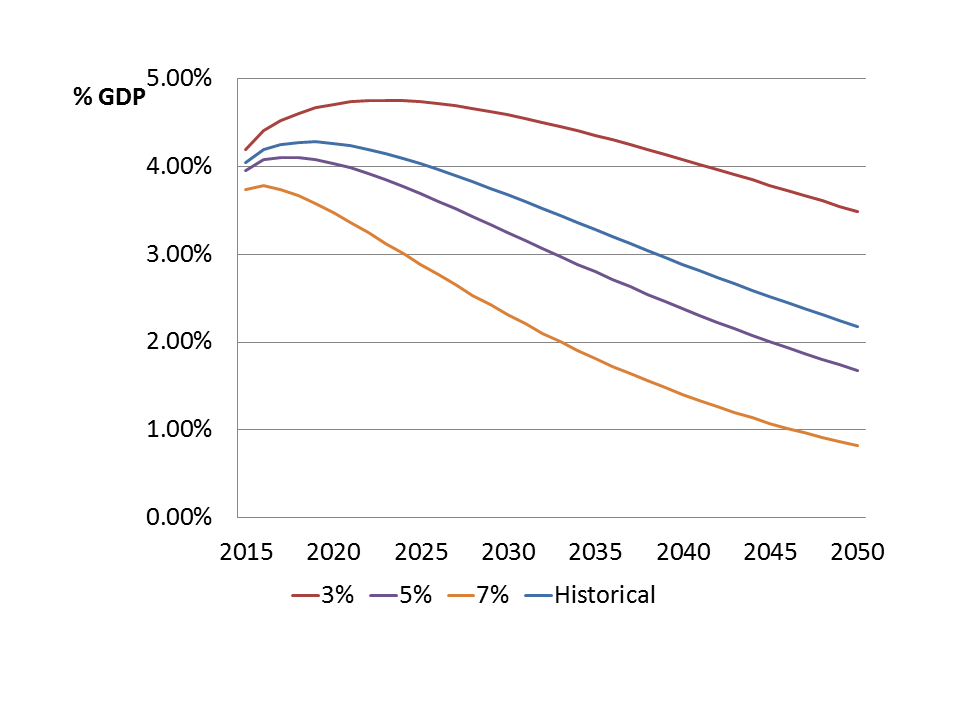 Figure 2: Long-run evolution of the cost of ART provision as a % of GDP in Malawi, for different GDP growth scenarios.